
Switch to List View
Image and Video Gallery
This is a searchable collection of scientific photos, illustrations, and videos. The images and videos in this gallery are licensed under Creative Commons Attribution Non-Commercial ShareAlike 3.0. This license lets you remix, tweak, and build upon this work non-commercially, as long as you credit and license your new creations under identical terms.
5896: Stetten Lecture 2017poster image
5896: Stetten Lecture 2017poster image
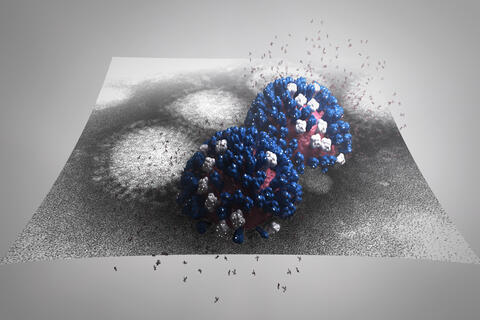
This image is featured on the poster for Dr. Rommie Amaro's 2017 Stetten Lecture. It depicts a detailed physical model of an influenza virus, incorporating information from several structural data sources. The small molecules around the virus are sialic acid molecules. The virus binds to and cleaves sialic acid as it enters and exits host cells. Researchers are building these highly detailed molecular scale models of different biomedical systems and then “bringing them to life” with physics-based methods, either molecular or Brownian dynamics simulations, to understand the structural dynamics of the systems and their complex interactions with drug or substrate molecules.
Dr. Rommie Amaro, University of California, San Diego
View Media
1278: Golgi theories
1278: Golgi theories
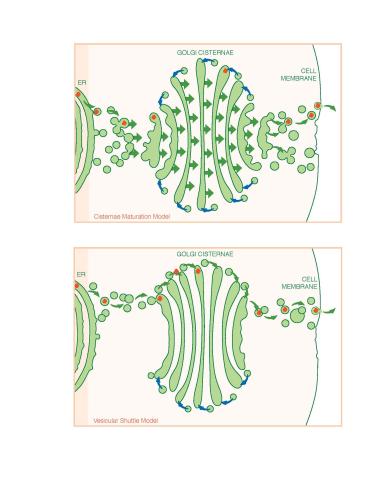
Two models for how material passes through the Golgi apparatus: the vesicular shuttle model and the cisternae maturation model.
Judith Stoffer
View Media
6550: Time-lapse video of floral pattern in a mixture of two bacterial species, Acinetobacter baylyi and Escherichia coli, grown on a semi-solid agar for 24 hours
6550: Time-lapse video of floral pattern in a mixture of two bacterial species, Acinetobacter baylyi and Escherichia coli, grown on a semi-solid agar for 24 hours
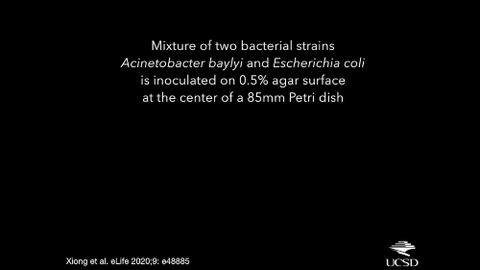
This time-lapse video shows the emergence of a flower-like pattern in a mixture of two bacterial species, motile Acinetobacter baylyi and non-motile Escherichia coli (green), that are grown together for 24 hours on 0.75% agar surface from a small inoculum in the center of a Petri dish.
See 6557 for a photo of this process at 24 hours on 0.75% agar surface.
See 6553 for a photo of this process at 48 hours on 1% agar surface.
See 6555 for another photo of this process at 48 hours on 1% agar surface.
See 6556 for a photo of this process at 72 hours on 0.5% agar surface.
See 6557 for a photo of this process at 24 hours on 0.75% agar surface.
See 6553 for a photo of this process at 48 hours on 1% agar surface.
See 6555 for another photo of this process at 48 hours on 1% agar surface.
See 6556 for a photo of this process at 72 hours on 0.5% agar surface.
L. Xiong et al, eLife 2020;9: e48885
View Media
2510: From DNA to Protein (labeled)
2510: From DNA to Protein (labeled)
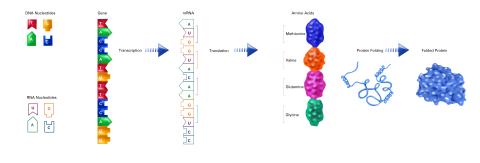
The genetic code in DNA is transcribed into RNA, which is translated into proteins with specific sequences. During transcription, nucleotides in DNA are copied into RNA, where they are read three at a time to encode the amino acids in a protein. Many parts of a protein fold as the amino acids are strung together.
See image 2509 for an unlabeled version of this illustration.
Featured in The Structures of Life.
See image 2509 for an unlabeled version of this illustration.
Featured in The Structures of Life.
Crabtree + Company
View Media
3644: Zebrafish embryo
3644: Zebrafish embryo
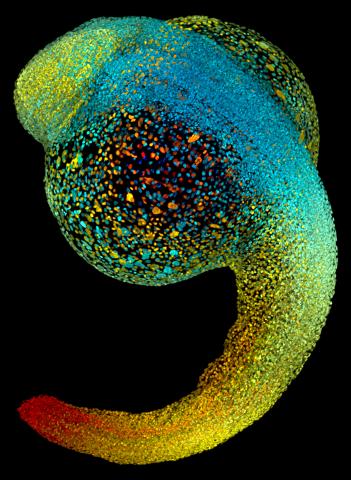
Just 22 hours after fertilization, this zebrafish embryo is already taking shape. By 36 hours, all of the major organs will have started to form. The zebrafish's rapid growth and see-through embryo make it ideal for scientists studying how organs develop.
This image was part of the Life: Magnified exhibit that ran from June 3, 2014, to January 21, 2015, at Dulles International Airport.
This image was part of the Life: Magnified exhibit that ran from June 3, 2014, to January 21, 2015, at Dulles International Airport.
Philipp Keller, Bill Lemon, Yinan Wan, and Kristin Branson, Janelia Farm Research Campus, Howard Hughes Medical Institute, Ashburn, Va.
View Media
3329: Spreading Cells- 02
3329: Spreading Cells- 02
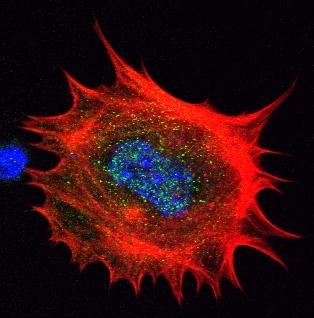
Cells move forward with lamellipodia and filopodia supported by networks and bundles of actin filaments. Proper, controlled cell movement is a complex process. Recent research has shown that an actin-polymerizing factor called the Arp2/3 complex is the key component of the actin polymerization engine that drives amoeboid cell motility. ARPC3, a component of the Arp2/3 complex, plays a critical role in actin nucleation. In this photo, the ARPC3-/- fibroblast cells were fixed and stained with Alexa 546 phalloidin for F-actin (red), Arp2 (green), and DAPI to visualize the nucleus (blue). Arp2, a subunit of the Arp2/3 complex, is absent in the filopodi-like structures based leading edge of ARPC3-/- fibroblasts cells. Related to images 3328, 3330, 3331, 3332, and 3333.
Rong Li and Praveen Suraneni, Stowers Institute for Medical Research
View Media
2417: Fly by night
2417: Fly by night
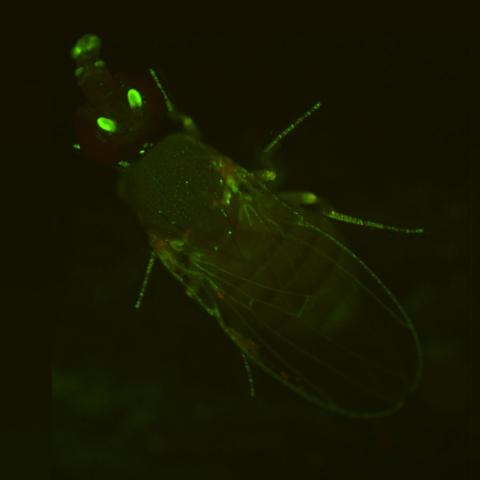
This fruit fly expresses green fluorescent protein (GFP) in the same pattern as the period gene, a gene that regulates circadian rhythm and is expressed in all sensory neurons on the surface of the fly.
Jay Hirsh, University of Virginia
View Media
6536: Sepsis Infographic
6536: Sepsis Infographic
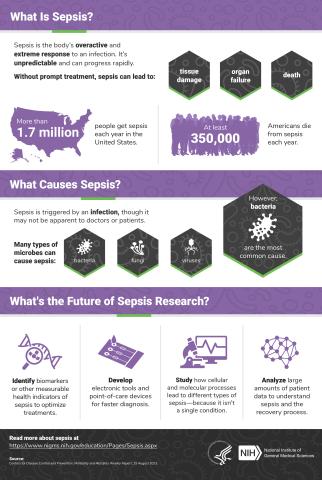
Sepsis is the body’s overactive and extreme response to an infection. More than 1.7 million people get sepsis each year in the United States. Without prompt treatment, sepsis can lead to tissue damage, organ failure, and death. Many NIGMS-supported researchers are working to improve sepsis diagnosis and treatment. Learn more with our sepsis featured topic page.
See 6551 for the Spanish version of this infographic.
See 6551 for the Spanish version of this infographic.
National Institute of General Medical Sciences
View Media
6898: Crane fly spermatocyte undergoing meiosis
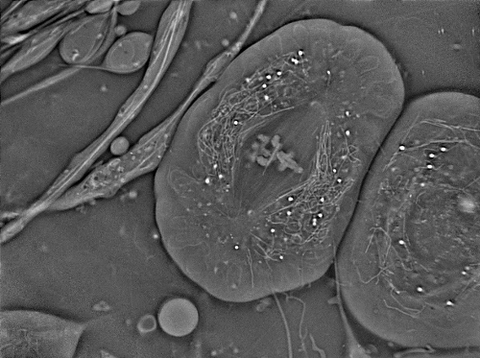
6898: Crane fly spermatocyte undergoing meiosis
A crane fly spermatocyte during metaphase of meiosis-I, a step in the production of sperm. A meiotic spindle pulls apart three pairs of autosomal chromosomes, along with a sex chromosome on the right. Tubular mitochondria surround the spindle and chromosomes. This video was captured with quantitative orientation-independent differential interference contrast and is a time lapse showing a 1-second image taken every 30 seconds over the course of 30 minutes.
More information about the research that produced this video can be found in the J. Biomed Opt. paper “Orientation-Independent Differential Interference Contrast (DIC) Microscopy and Its Combination with Orientation-Independent Polarization System” by Shribak et. al.
More information about the research that produced this video can be found in the J. Biomed Opt. paper “Orientation-Independent Differential Interference Contrast (DIC) Microscopy and Its Combination with Orientation-Independent Polarization System” by Shribak et. al.
Michael Shribak, Marine Biological Laboratory/University of Chicago.
View Media
2358: Advanced Photon Source (APS) at Argonne National Lab
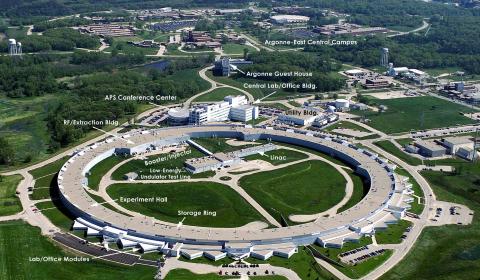
2358: Advanced Photon Source (APS) at Argonne National Lab
The intense X-rays produced by synchrotrons such as the Advanced Photon Source are ideally suited for protein structure determination. Using synchrotron X-rays and advanced computers scientists can determine protein structures at a pace unheard of decades ago.
Southeast Collaboratory for Structural Genomics
View Media
5800: Mouse cerebellum in pink and blue
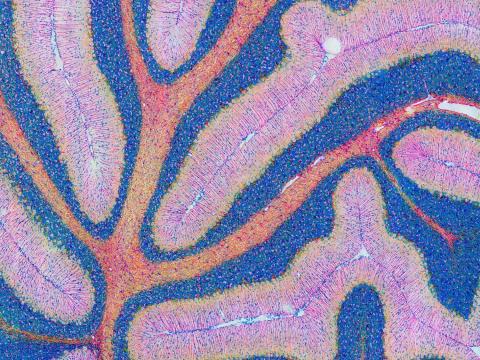
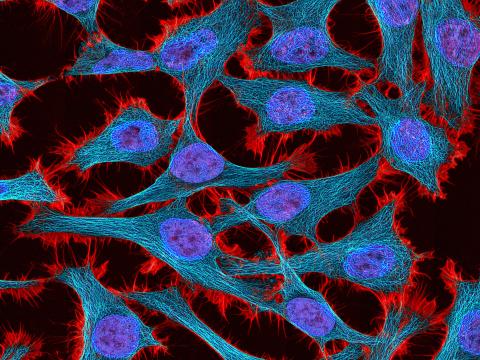
5800: Mouse cerebellum in pink and blue
The cerebellum is the brain's locomotion control center. Found at the base of your brain, the cerebellum is a single layer of tissue with deep folds like an accordion. People with damage to this region of the brain often have difficulty with balance, coordination and fine motor skills.
This image of a mouse cerebellum is part of a collection of such images in different colors and at different levels of magnification from the National Center for Microscopy and Imaging Research (NCMIR). Related to image 5795.
This image of a mouse cerebellum is part of a collection of such images in different colors and at different levels of magnification from the National Center for Microscopy and Imaging Research (NCMIR). Related to image 5795.
National Center for Microscopy and Imaging Research (NCMIR)
View Media

2714: Stretch detectors
2714: Stretch detectors
Muscles stretch and contract when we walk, and skin splits open and knits back together when we get a paper cut. To study these contractile forces, researchers built a three-dimensional scaffold that mimics tissue in an organism. Researchers poured a mixture of cells and elastic collagen over microscopic posts in a dish. Then they studied how the cells pulled and released the posts as they formed a web of tissue. To measure forces between posts, the researchers developed a computer model. Their findings--which show that contractile forces vary throughout the tissue--could have a wide range of medical applications.
Christopher Chen, University of Pennsylvania
View Media
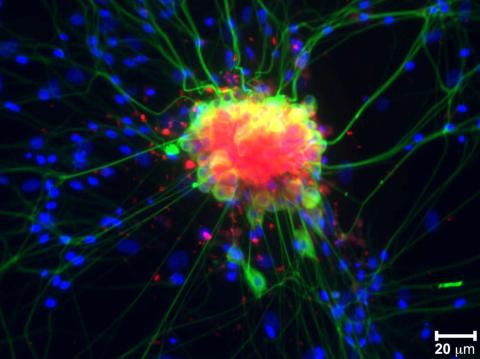
3271: Dopaminergic neurons derived from mouse embryonic stem cells
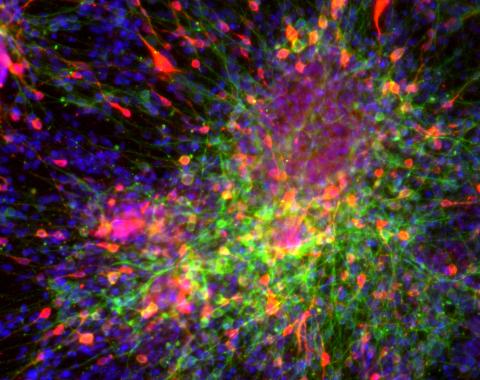
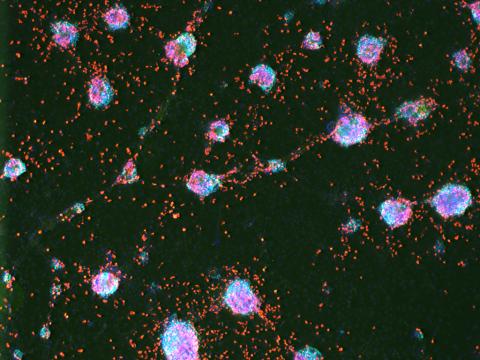
3271: Dopaminergic neurons derived from mouse embryonic stem cells
These neurons are derived from mouse embryonic stem cells. Red shows cells making a protein called TH that is characteristic of the neurons that degenerate in Parkinson's disease. Green indicates a protein that's found in all neurons. Blue indicates the nuclei of all cells. Studying dopaminergic neurons can help researchers understand the origins of Parkinson's disease and could be used to screen potential new drugs. Image and caption information courtesy of the California Institute for Regenerative Medicine. Related to images 3270 and 3285.
Yaping Sun, lab of Su Guo, University of California, San Francisco, via CIRM
View Media
6569: Cryo-electron tomography of a Caulobacter bacterium
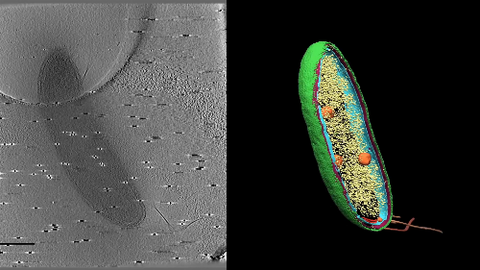
6569: Cryo-electron tomography of a Caulobacter bacterium
3D image of Caulobacter bacterium with various components highlighted: cell membranes (red and blue), protein shell (green), protein factories known as ribosomes (yellow), and storage granules (orange).
Peter Dahlberg, Stanford University.
View Media
3584: Rotavirus structure
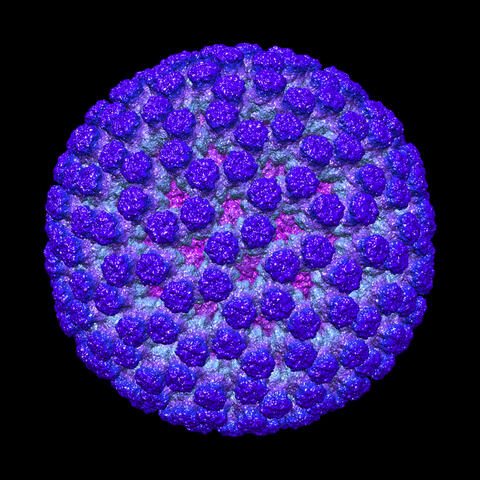
3584: Rotavirus structure
This image shows a computer-generated, three-dimensional map of the rotavirus structure. This virus infects humans and other animals and causes severe diarrhea in infants and young children. By the age of five, almost every child in the world has been infected with this virus at least once. Scientists have found a vaccine against rotavirus, so in the United States there are very few fatalities, but in developing countries and in places where the vaccine is unavailable, this virus is responsible for more than 200,000 deaths each year.
The rotavirus comprises three layers: the outer, middle and inner layers. On infection, the outer layer is removed, leaving behind a "double-layered particle." Researchers have studied the structure of this double-layered particle with a transmission electron microscope. Many images of the virus at a magnification of ~50,000x were acquired, and computational analysis was used to combine the individual particle images into a three-dimensional reconstruction.
The image was rendered by Melody Campbell (PhD student at TSRI). Work that led to the 3D map was published in Campbell et al. Movies of ice-embedded particles enhance resolution in electron cryo-microscopy. Structure. 2012;20(11):1823-8. PMCID: PMC3510009.
This image was part of the Life: Magnified exhibit that ran from June 3, 2014, to January 21, 2015, at Dulles International Airport.
Bridget Carragher, The Scripps Research Institute, La Jolla, CA
View Media
6487: CRISPR Illustration Frame 3
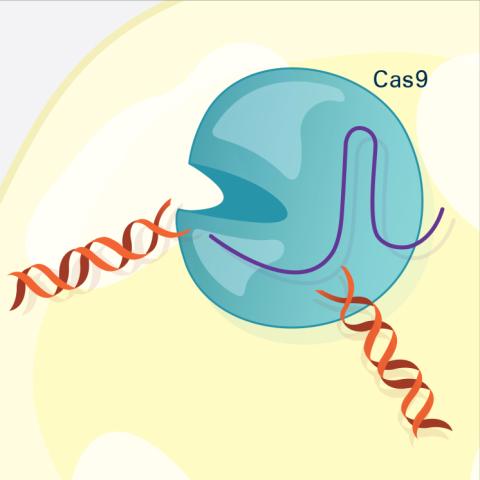
6487: CRISPR Illustration Frame 3
This illustration shows, in simplified terms, how the CRISPR-Cas9 system can be used as a gene-editing tool. The CRISPR system has two components joined together: a finely tuned targeting device (a small strand of RNA programmed to look for a specific DNA sequence) and a strong cutting device (an enzyme called Cas9 that can cut through a double strand of DNA). In this frame (3 of 4), the Cas9 enzyme cuts both strands of the DNA.
For an explanation and overview of the CRISPR-Cas9 system, see the iBiology video, and find the full CRIPSR illustration here.
For an explanation and overview of the CRISPR-Cas9 system, see the iBiology video, and find the full CRIPSR illustration here.
National Institute of General Medical Sciences.
View Media
1290: Nucleus and rough ER
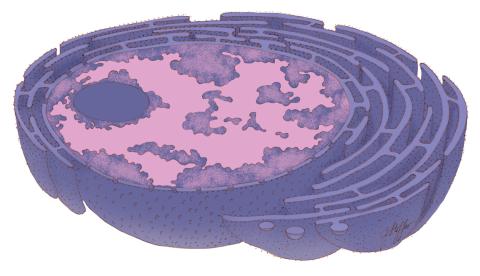
1290: Nucleus and rough ER
The nucleus contains the DNA of eukaryotic cells. The double membrane that bounds the nucleus flows into the rough endoplasmic reticulum, an organelle studded with ribosomes that manufacture membrane-bound proteins for the rest of the cell.
Judith Stoffer
View Media
1332: Mitosis - telophase
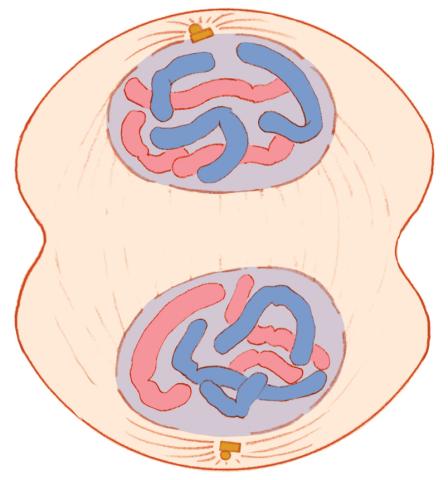
1332: Mitosis - telophase
Telophase during mitosis: Nuclear membranes form around each of the two sets of chromosomes, the chromosomes begin to spread out, and the spindle begins to break down. Mitosis is responsible for growth and development, as well as for replacing injured or worn out cells throughout the body. For simplicity, mitosis is illustrated here with only six chromosomes.
Judith Stoffer
View Media
6902: Arachnoidiscus diatom
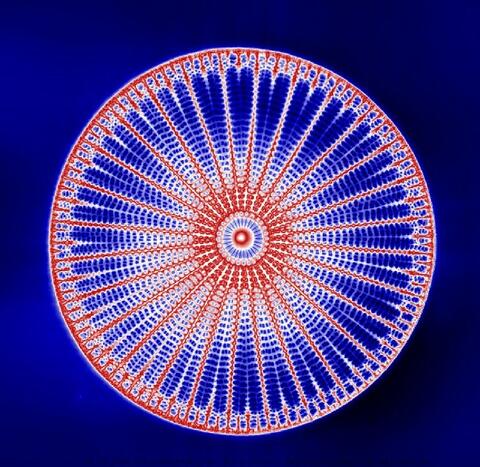
6902: Arachnoidiscus diatom
An Arachnoidiscus diatom with a diameter of 190µm. Diatoms are microscopic algae that have cell walls made of silica, which is the strongest known biological material relative to its density. In Arachnoidiscus, the cell wall is a radially symmetric pillbox-like shell composed of overlapping halves that contain intricate and delicate patterns. Sometimes, Arachnoidiscus is called “a wheel of glass.”
This image was taken with the orientation-independent differential interference contrast microscope.
This image was taken with the orientation-independent differential interference contrast microscope.
Michael Shribak, Marine Biological Laboratory/University of Chicago.
View Media
3314: Human opioid receptor structure superimposed on poppy
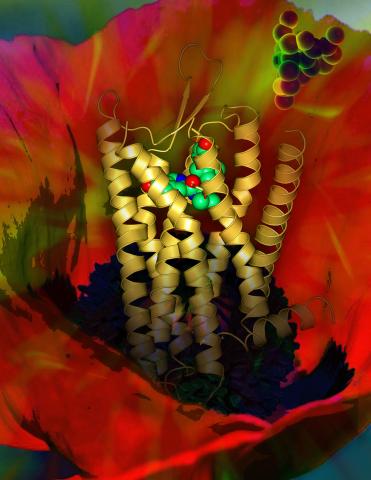
3314: Human opioid receptor structure superimposed on poppy
Opioid receptors on the surfaces of brain cells are involved in pleasure, pain, addiction, depression, psychosis, and other conditions. The receptors bind to both innate opioids and drugs ranging from hospital anesthetics to opium. Researchers at The Scripps Research Institute, supported by the NIGMS Protein Structure Initiative, determined the first three-dimensional structure of a human opioid receptor, a kappa-opioid receptor. In this illustration, the submicroscopic receptor structure is shown while bound to an agonist (or activator). The structure is superimposed on a poppy flower, the source of opium.
Raymond Stevens, The Scripps Research Institute
View Media
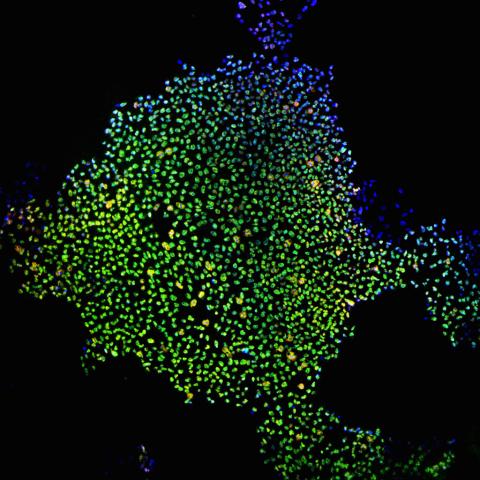
3275: Human embryonic stem cells on feeder cells
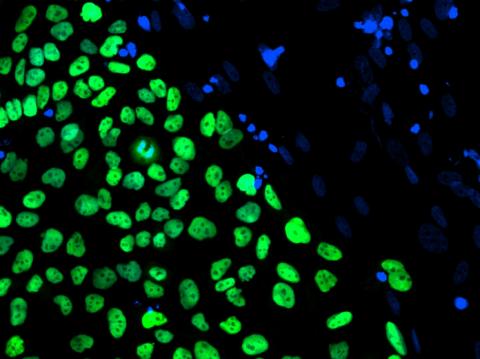
3275: Human embryonic stem cells on feeder cells
The nuclei stained green highlight human embryonic stem cells grown under controlled conditions in a laboratory. Blue represents the DNA of surrounding, supportive feeder cells. Image and caption information courtesy of the California Institute for Regenerative Medicine. See related image 3724.
Julie Baker lab, Stanford University School of Medicine, via CIRM
View Media
6767: Space-filling model of a cefotaxime-CCD-1 complex
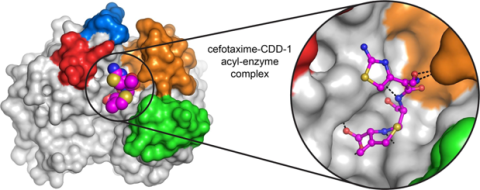
6767: Space-filling model of a cefotaxime-CCD-1 complex
CCD-1 is an enzyme produced by the bacterium Clostridioides difficile that helps it resist antibiotics. Using X-ray crystallography, researchers determined the structure of a complex between CCD-1 and the antibiotic cefotaxime (purple, yellow, and blue molecule). The structure revealed that CCD-1 provides extensive hydrogen bonding (shown as dotted lines) and stabilization of the antibiotic in the active site, leading to efficient degradation of the antibiotic.
Related to images 6764, 6765, and 6766.
Related to images 6764, 6765, and 6766.
Keith Hodgson, Stanford University.
View Media
6589: Cell-like compartments emerging from scrambled frog eggs 3
6589: Cell-like compartments emerging from scrambled frog eggs 3
Cell-like compartments spontaneously emerge from scrambled frog eggs. Endoplasmic reticulum (red) and microtubules (green) are visible. Video created using epifluorescence microscopy.
For more photos of cell-like compartments from frog eggs view: 6584, 6585, 6586, 6591, 6592, and 6593.
For videos of cell-like compartments from frog eggs view: 6587, 6588, and 6590.
Xianrui Cheng, Stanford University School of Medicine.
View Media
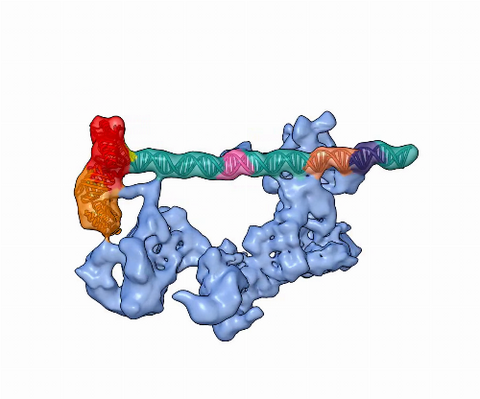
3434: Flu virus proteins during self-replication
3434: Flu virus proteins during self-replication
Influenza (flu) virus proteins in the act of self-replication. Viral nucleoprotein (blue) encapsidates [encapsulates] the RNA genome (green). The influenza virus polymerase (orange) reads and copies the RNA genome. In the background is an image of influenza virus ribonucleoprotein complexes observed using cryo-electron microscopy. This image is from a November 2012 News Release.
Scripps Research Institute in La Jolla, CA
View Media
2553: Alternative splicing (with labels)
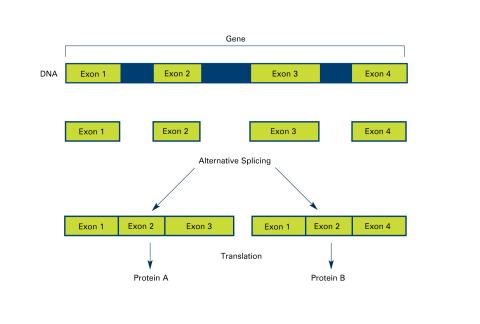
2553: Alternative splicing (with labels)
Arranging exons in different patterns, called alternative splicing, enables cells to make different proteins from a single gene. Featured in The New Genetics.
See image 2552 for an unlabeled version of this illustration.
See image 2552 for an unlabeled version of this illustration.
Crabtree + Company
View Media
2554: RNA strand
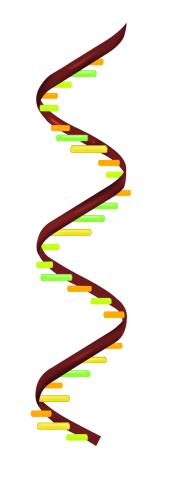
2554: RNA strand
Ribonucleic acid (RNA) has a sugar-phosphate backbone and the bases adenine (A), cytosine (C), guanine (G), and uracil (U). See image 2555 for a labeled version of this illustration. Featured in The New Genetics.
Crabtree + Company
View Media
3403: Disrupted vascular development in frog embryos
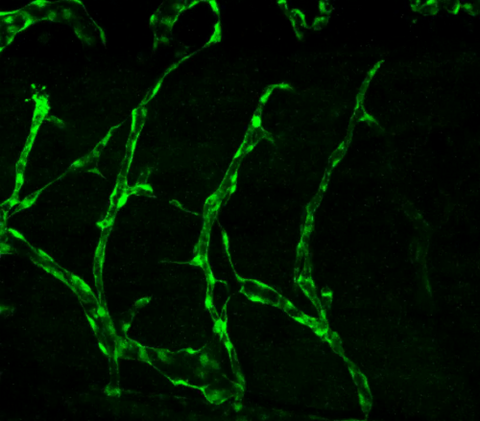
3403: Disrupted vascular development in frog embryos
Disassembly of vasculature in kdr:GFP frogs following addition of 250 µM TBZ. Related to images 3404 and 3505.
Hye Ji Cha, University of Texas at Austin
View Media
6886: Neutrophil-like cells migrating in a microfluidic chip
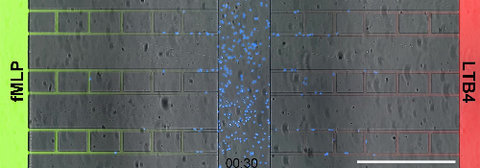
6886: Neutrophil-like cells migrating in a microfluidic chip
Neutrophil-like cells (blue) in a microfluidic chip preferentially migrating toward LTB4 over fMLP. A neutrophil is a type of white blood cell that is part of the immune system and helps the body fight infection. Both LTB4 and fMLP are molecules involved in immune response. Microfluidic chips are small devices containing microscopic channels, and they are used in a range of applications, from basic research on cells to pathogen detection. The scale bar in this video is 500μm.
Caroline Jones, University of Texas at Dallas.
View Media
6964: Crawling cell
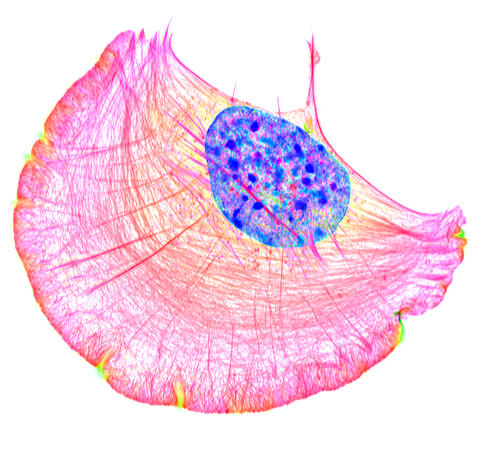
6964: Crawling cell
A crawling cell with DNA shown in blue and actin filaments, which are a major component of the cytoskeleton, visible in pink. Actin filaments help enable cells to crawl. This image was captured using structured illumination microscopy.
Dylan T. Burnette, Vanderbilt University School of Medicine.
View Media
3445: Dividing cell in metaphase
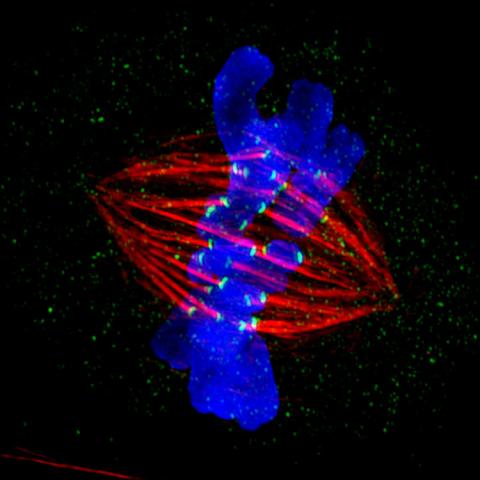
3445: Dividing cell in metaphase
This image of a mammalian epithelial cell, captured in metaphase, was the winning image in the high- and super-resolution microscopy category of the 2012 GE Healthcare Life Sciences Cell Imaging Competition. The image shows microtubules (red), kinetochores (green) and DNA (blue). The DNA is fixed in the process of being moved along the microtubules that form the structure of the spindle.
The image was taken using the DeltaVision OMX imaging system, affectionately known as the "OMG" microscope, and was displayed on the NBC screen in New York's Times Square during the weekend of April 20-21, 2013. It was also part of the Life: Magnified exhibit that ran from June 3, 2014, to January 21, 2015, at Dulles International Airport.
The image was taken using the DeltaVision OMX imaging system, affectionately known as the "OMG" microscope, and was displayed on the NBC screen in New York's Times Square during the weekend of April 20-21, 2013. It was also part of the Life: Magnified exhibit that ran from June 3, 2014, to January 21, 2015, at Dulles International Airport.
Jane Stout in the laboratory of Claire Walczak, Indiana University, GE Healthcare 2012 Cell Imaging Competition
View Media
2410: DNase
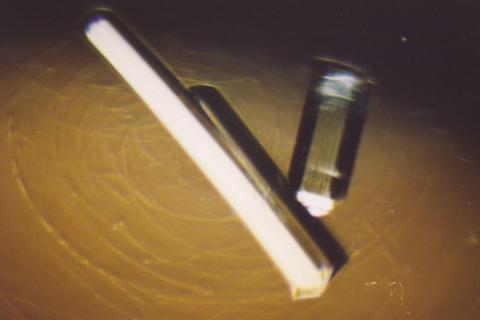
2410: DNase
Crystals of DNase protein created for X-ray crystallography, which can reveal detailed, three-dimensional protein structures.
Alex McPherson, University of California, Irvine
View Media
3489: Worm sperm
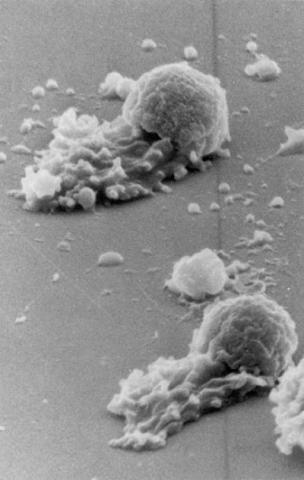
3489: Worm sperm
To develop a system for studying cell motility in unnatrual conditions -- a microscope slide instead of the body -- Tom Roberts and Katsuya Shimabukuro at Florida State University disassembled and reconstituted the motility parts used by worm sperm cells.
Tom Roberts, Florida State University
View Media
2607: Mouse embryo showing Smad4 protein
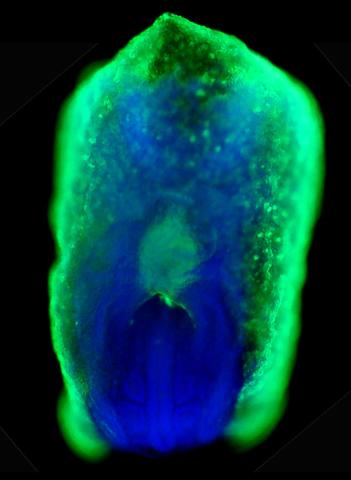
2607: Mouse embryo showing Smad4 protein
This eerily glowing blob isn't an alien or a creature from the deep sea--it's a mouse embryo just eight and a half days old. The green shell and core show a protein called Smad4. In the center, Smad4 is telling certain cells to begin forming the mouse's liver and pancreas. Researchers identified a trio of signaling pathways that help switch on Smad4-making genes, starting immature cells on the path to becoming organs. The research could help biologists learn how to grow human liver and pancreas tissue for research, drug testing and regenerative medicine. In addition to NIGMS, NIH's National Institute of Diabetes and Digestive and Kidney Diseases also supported this work.
Kenneth Zaret, Fox Chase Cancer Center
View Media
6750: C. elegans with blue and yellow lights in the background
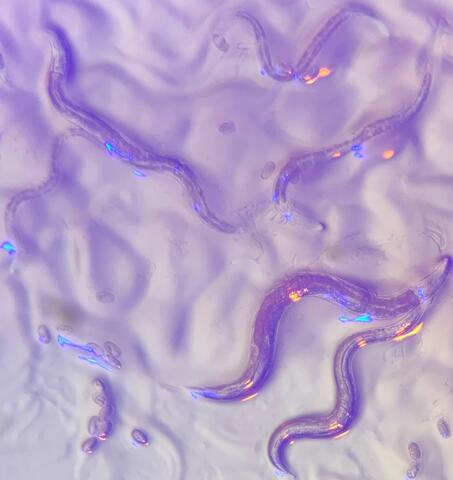
6750: C. elegans with blue and yellow lights in the background
These microscopic roundworms, called Caenorhabditis elegans, lack eyes and the opsin proteins used by visual systems to detect colors. However, researchers found that the worms can still sense the color of light in a way that enables them to avoid pigmented toxins made by bacteria. This image was captured using a stereo microscope.
H. Robert Horvitz and Dipon Ghosh, Massachusetts Institute of Technology.
View Media
2450: Blood clots show their flex
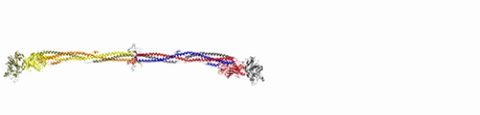
2450: Blood clots show their flex
Blood clots stop bleeding, but they also can cause heart attacks and strokes. A team led by computational biophysicist Klaus Schulten of the University of Illinois at Urbana-Champaign has revealed how a blood protein can give clots their lifesaving and life-threatening abilities. The researchers combined experimental and computational methods to animate fibrinogen, a protein that forms the elastic fibers that enable clots to withstand the force of blood pressure. This simulation shows that the protein, through a series of events, stretches up to three times its length. Adjusting this elasticity could improve how we manage healthful and harmful clots. NIH's National Center for Research Resources also supported this work. Featured in the March 19, 2008, issue of Biomedical Beat.
Eric Lee, University of Illinois at Urbana-Champaign
View Media
3614: Birth of a yeast cell
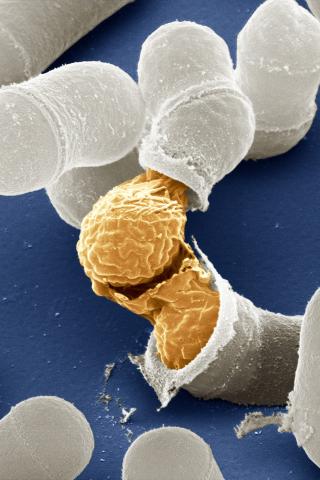
3614: Birth of a yeast cell
Yeast make bread, beer, and wine. And like us, yeast can reproduce sexually. A mother and father cell fuse and create one large cell that contains four offspring. When environmental conditions are favorable, the offspring are released, as shown here. Yeast are also a popular study subject for scientists. Research on yeast has yielded vast knowledge about basic cellular and molecular biology as well as about myriad human diseases, including colon cancer and various metabolic disorders.
This image was part of the Life: Magnified exhibit that ran from June 3, 2014, to January 21, 2015, at Dulles International Airport.
This image was part of the Life: Magnified exhibit that ran from June 3, 2014, to January 21, 2015, at Dulles International Airport.
Juergen Berger, Max Planck Institute for Developmental Biology, and Maria Langegger, Friedrich Miescher Laboratory of the Max Planck Society, Germany
View Media
5825: A Growing Bacterial Biofilm
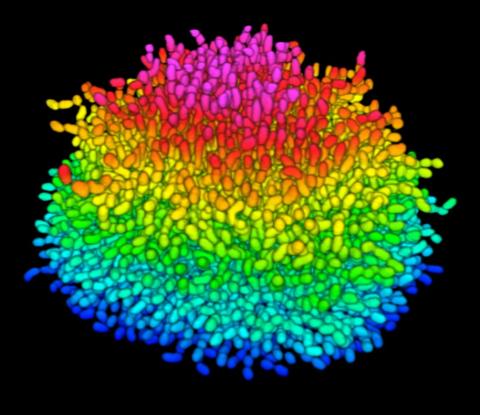
5825: A Growing Bacterial Biofilm
A growing Vibrio cholerae (cholera) biofilm. Cholera bacteria form colonies called biofilms that enable them to resist antibiotic therapy within the body and other challenges to their growth.
Each slightly curved comma shape represents an individual bacterium from assembled confocal microscopy images. Different colors show each bacterium’s position in the biofilm in relation to the surface on which the film is growing.
Each slightly curved comma shape represents an individual bacterium from assembled confocal microscopy images. Different colors show each bacterium’s position in the biofilm in relation to the surface on which the film is growing.
Jing Yan, Ph.D., and Bonnie Bassler, Ph.D., Department of Molecular Biology, Princeton University, Princeton, NJ.
View Media
2604: Induced stem cells from adult skin 02
2604: Induced stem cells from adult skin 02
These cells are induced stem cells made from human adult skin cells that were genetically reprogrammed to mimic embryonic stem cells. The induced stem cells were made potentially safer by removing the introduced genes and the viral vector used to ferry genes into the cells, a loop of DNA called a plasmid. The work was accomplished by geneticist Junying Yu in the laboratory of James Thomson, a University of Wisconsin-Madison School of Medicine and Public Health professor and the director of regenerative biology for the Morgridge Institute for Research.
James Thomson, University of Wisconsin-Madison
View Media
3251: Spinal nerve cells
3251: Spinal nerve cells
Neurons (green) and glial cells from isolated dorsal root ganglia express COX-2 (red) after exposure to an inflammatory stimulus (cell nuclei are blue). Lawrence Marnett and colleagues have demonstrated that certain drugs selectively block COX-2 metabolism of endocannabinoids -- naturally occurring analgesic molecules -- in stimulated dorsal root ganglia. Featured in the October 20, 2011 issue of Biomedical Beat.
Lawrence Marnett, Vanderbilt University
View Media
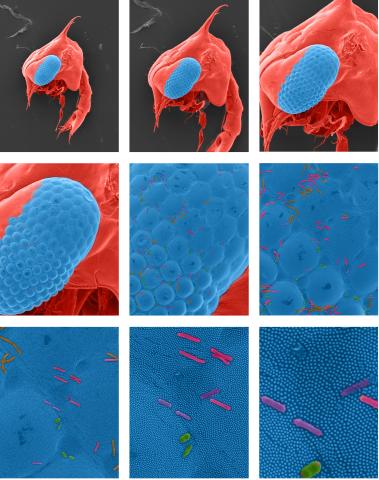
1251: Crab larva eye
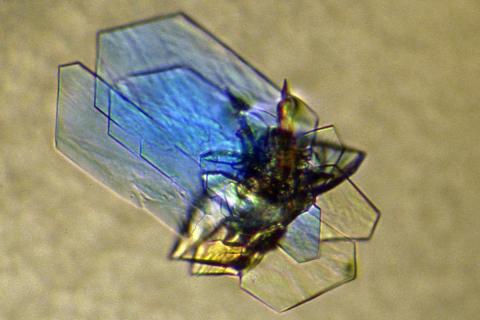
1251: Crab larva eye
Colorized scanning electron micrographs progressively zoom in on the eye of a crab larva. In the higher-resolution frames, bacteria are visible on the eye.
Tina Weatherby Carvalho, University of Hawaii at Manoa
View Media
5730: Dynamic cryo-EM model of the human transcription preinitiation complex
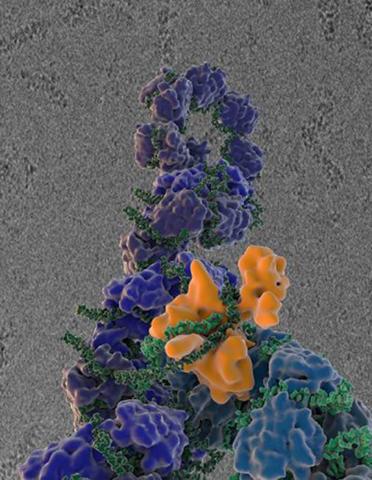
5730: Dynamic cryo-EM model of the human transcription preinitiation complex
Gene transcription is a process by which information encoded in DNA is transcribed into RNA. It's essential for all life and requires the activity of proteins, called transcription factors, that detect where in a DNA strand transcription should start. In eukaryotes (i.e., those that have a nucleus and mitochondria), a protein complex comprising 14 different proteins is responsible for sniffing out transcription start sites and starting the process. This complex represents the core machinery to which an enzyme, named RNA polymerase, can bind to and read the DNA and transcribe it to RNA. Scientists have used cryo-electron microscopy (cryo-EM) to visualize the TFIID-RNA polymerase-DNA complex in unprecedented detail. This animation shows the different TFIID components as they contact DNA and recruit the RNA polymerase for gene transcription.
To learn more about the research that has shed new light on gene transcription, see this news release from Berkeley Lab.
Related to image 3766.
To learn more about the research that has shed new light on gene transcription, see this news release from Berkeley Lab.
Related to image 3766.
Eva Nogales, Berkeley Lab
View Media

2702: Thermotoga maritima and its metabolic network
2702: Thermotoga maritima and its metabolic network
A combination of protein structures determined experimentally and computationally shows us the complete metabolic network of a heat-loving bacterium.
View Media
6892: Microtubules and tau aggregates
6892: Microtubules and tau aggregates
Microtubules (magenta) and tau protein (light blue) in a cell model of tauopathy. Researchers believe that tauopathy—the aggregation of tau protein—plays a role in Alzheimer’s disease and other neurodegenerative diseases. This image was captured using Stochastic Optical Reconstruction Microscopy (STORM).
Related to images 6889, 6890, and 6891.
Related to images 6889, 6890, and 6891.
Melike Lakadamyali, Perelman School of Medicine at the University of Pennsylvania.
View Media
3521: HeLa cells
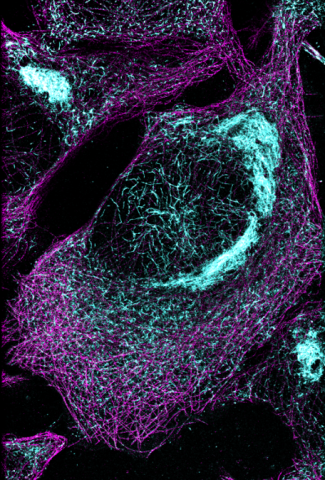
3521: HeLa cells
Multiphoton fluorescence image of HeLa cells stained with the actin binding toxin phalloidin (red), microtubules (cyan) and cell nuclei (blue). Nikon RTS2000MP custom laser scanning microscope. See related images 3518, 3519, 3520, 3522.
National Center for Microscopy and Imaging Research (NCMIR)
View Media
3277: Human ES cells turn into insulin-producing cells
3277: Human ES cells turn into insulin-producing cells
Human embryonic stem cells were differentiated into cells like those found in the pancreas (blue), which give rise to insulin-producing cells (red). When implanted in mice, the stem cell-derived pancreatic cells can replace the insulin that isn't produced in type 1 diabetes. Image and caption information courtesy of the California Institute for Regenerative Medicine.
Eugene Brandon, ViaCyte, via CIRM
View Media
2574: Simulation of uncontrolled avian flu outbreak
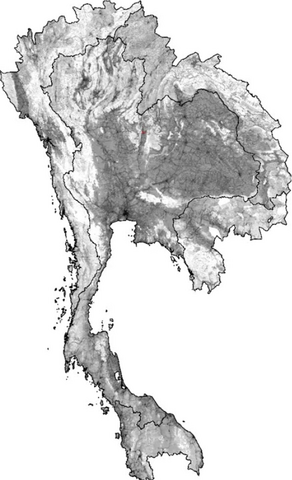
2574: Simulation of uncontrolled avian flu outbreak
This video simulation shows what an uncontrolled outbreak of transmissible avian flu among people living in Thailand might look like. Red indicates new cases while green indicates areas where the epidemic has finished. The video shows the spread of infection and recovery over 300 days in Thailand and neighboring countries.
Neil M. Ferguson, Imperial College London
View Media
2404: Bovine milk alpha-lactalbumin (2)
2404: Bovine milk alpha-lactalbumin (2)
Crystals of bovine milk alpha-lactalbumin protein created for X-ray crystallography, which can reveal detailed, three-dimensional protein structures.
Alex McPherson, University of California, Irvine
View Media
3442: Cell division phases in Xenopus frog cells
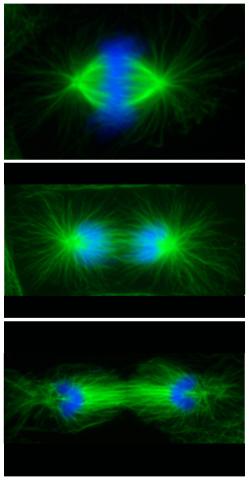
3442: Cell division phases in Xenopus frog cells
These images show three stages of cell division in Xenopus XL177 cells, which are derived from tadpole epithelial cells. They are (from top): metaphase, anaphase and telophase. The microtubules are green and the chromosomes are blue. Related to 3443.
Claire Walczak, who took them while working as a postdoc in the laboratory of Timothy Mitchison
View Media
3290: Three neurons and human ES cells
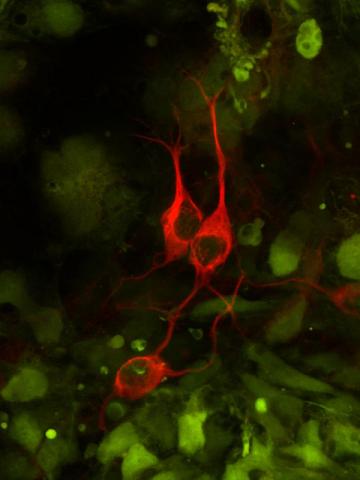
3290: Three neurons and human ES cells
The three neurons (red) visible in this image were derived from human embryonic stem cells. Undifferentiated stem cells are green here. Image and caption information courtesy of the California Institute for Regenerative Medicine.
Anirvan Ghosh lab, University of California, San Diego, via CIRM
View Media
2426: Zinc finger
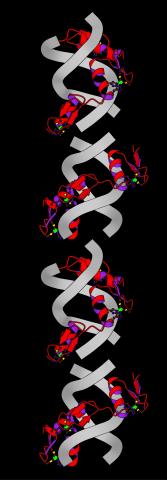
2426: Zinc finger
The structure of a gene-regulating zinc finger protein bound to DNA.
Jeremy M. Berg, National Institute of General Medical Sciences
View Media