
Switch to List View
Image and Video Gallery
This is a searchable collection of scientific photos, illustrations, and videos. The images and videos in this gallery are licensed under Creative Commons Attribution Non-Commercial ShareAlike 3.0. This license lets you remix, tweak, and build upon this work non-commercially, as long as you credit and license your new creations under identical terms.
3332: Polarized cells- 01
3332: Polarized cells- 01
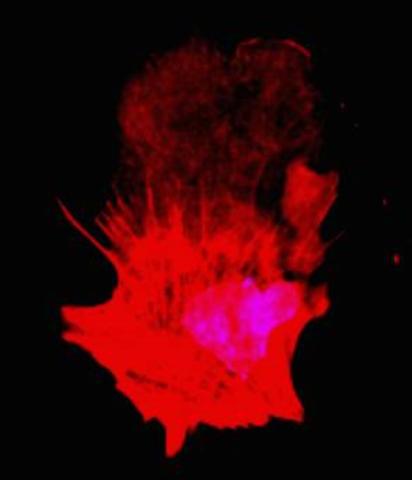
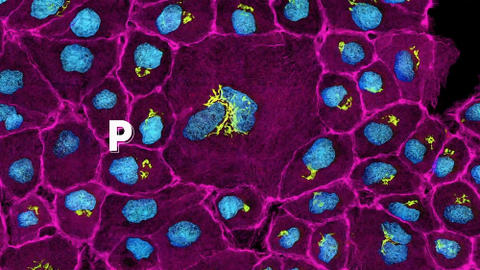
Cells move forward with lamellipodia and filopodia supported by networks and bundles of actin filaments. Proper, controlled cell movement is a complex process. Recent research has shown that an actin-polymerizing factor called the Arp2/3 complex is the key component of the actin polymerization engine that drives amoeboid cell motility. ARPC3, a component of the Arp2/3 complex, plays a critical role in actin nucleation. In this photo, the ARPC3+/+ fibroblast cells were fixed and stained with Alexa 546 phalloidin for F-actin (red) and DAPI to visualize the nucleus (blue). ARPC3+/+ fibroblast cells with lamellipodia leading edge. Related to images 3328, 3329, 3330, 3331, and 3333.
Rong Li and Praveen Suraneni, Stowers Institute for Medical Research
View Media
7003: Catalase diversity
7003: Catalase diversity
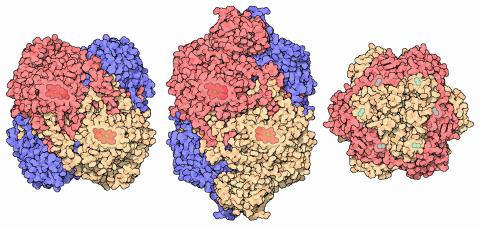
Catalases are some of the most efficient enzymes found in cells. Each catalase molecule can decompose millions of hydrogen peroxide molecules every second—working as an antioxidant to protect cells from the dangerous form of reactive oxygen. Different cells build different types of catalases. The human catalase that protects our red blood cells, shown on the left from PDB entry 1QQW, is composed of four identical subunits and uses a heme/iron group to perform the reaction. Many bacteria scavenge hydrogen peroxide with a larger catalase, shown in the center from PDB entry 1IPH, that uses a similar arrangement of iron and heme. Other bacteria protect themselves with an entirely different catalase that uses manganese ions instead of heme, as shown at the right from PDB entry 1JKU.
Amy Wu and Christine Zardecki, RCSB Protein Data Bank.
View Media

3547: Master clock of the mouse brain
3547: Master clock of the mouse brain
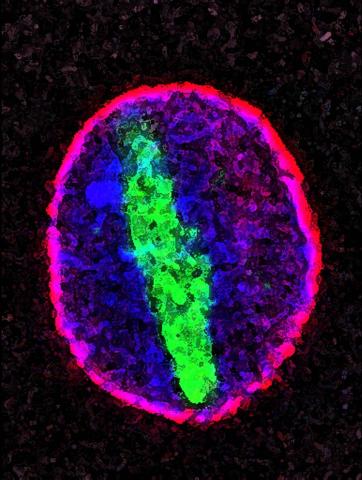
An image of the area of the mouse brain that serves as the 'master clock,' which houses the brain's time-keeping neurons. The nuclei of the clock cells are shown in blue. A small molecule called VIP, shown in green, enables neurons in the central clock in the mammalian brain to synchronize.
Erik Herzog, Washington University in St. Louis
View Media
3499: Growing hair follicle stem cells
3499: Growing hair follicle stem cells
Wound healing requires the action of stem cells. In mice that lack the Sept2/ARTS gene, stem cells involved in wound healing live longer and wounds heal faster and more thoroughly than in normal mice. This confocal microscopy image from a mouse lacking the Sept2/ARTS gene shows a tail wound in the process of healing. Cell nuclei are in blue. Red and orange mark hair follicle stem cells (hair follicle stem cells activate to cause hair regrowth, which indicates healing). See more information in the article in Science.
Hermann Steller, Rockefeller University
View Media
5755: Autofluorescent xanthophores in zebrafish skin
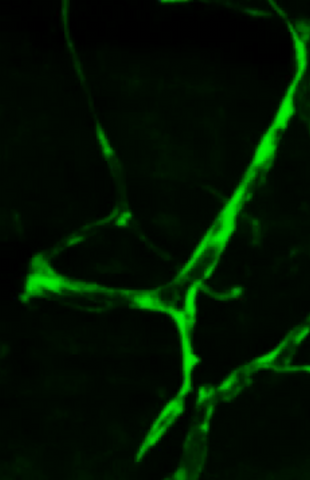
5755: Autofluorescent xanthophores in zebrafish skin
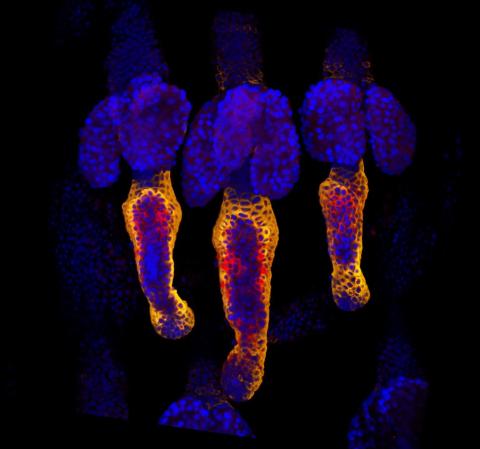
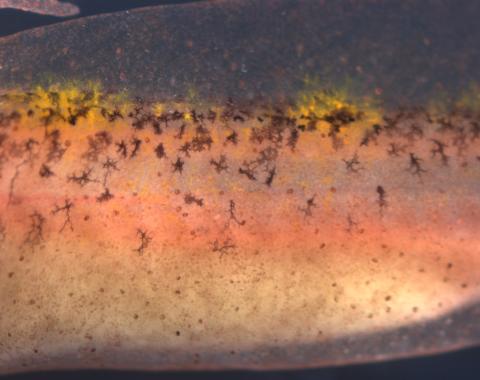
Pigment cells are cells that give skin its color. In fishes and amphibians, like frogs and salamanders, pigment cells are responsible for the characteristic skin patterns that help these organisms to blend into their surroundings or attract mates. The pigment cells are derived from neural crest cells, which are cells originating from the neural tube in the early embryo. This image shows pigment cells called xanthophores in the skin of zebrafish; the cells glow (autofluoresce) brightly under light giving the fish skin a shiny, lively appearance. Investigating pigment cell formation and migration in animals helps answer important fundamental questions about the factors that control pigmentation in the skin of animals, including humans. Related to images 5754, 5756, 5757 and 5758.
David Parichy, University of Washington
View Media
6753: Fruit fly nurse cells during egg development
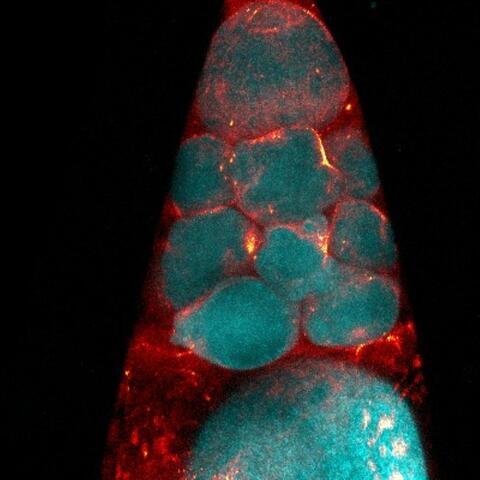
6753: Fruit fly nurse cells during egg development
In many animals, the egg cell develops alongside sister cells. These sister cells are called nurse cells in the fruit fly (Drosophila melanogaster), and their job is to “nurse” an immature egg cell, or oocyte. Toward the end of oocyte development, the nurse cells transfer all their contents into the oocyte in a process called nurse cell dumping. This process involves significant shape changes on the part of the nurse cells (blue), which are powered by wavelike activity of the protein myosin (red). This image was captured using a confocal laser scanning microscope. Related to video 6754.
Adam C. Martin, Massachusetts Institute of Technology.
View Media
2809: Vimentin in a quail embryo
2809: Vimentin in a quail embryo
Video of high-resolution confocal images depicting vimentin immunofluorescence (green) and nuclei (blue) at the edge of a quail embryo yolk. These images were obtained as part of a study to understand cell migration in embryos. An NIGMS grant to Professor Garcia was used to purchase the confocal microscope that collected these images. Related to images 2807 and 2808.
Andrés Garcia, Georgia Tech
View Media
3405: Disrupted and restored vasculature development in frog embryos
3405: Disrupted and restored vasculature development in frog embryos
Disassembly of vasculature and reassembly after addition and then washout of 250 µM TBZ in kdr:GFP frogs. Related to images 3403 and 3404.
Hye Ji Cha, University of Texas at Austin
View Media
3406: Phenylalanine tRNA molecule
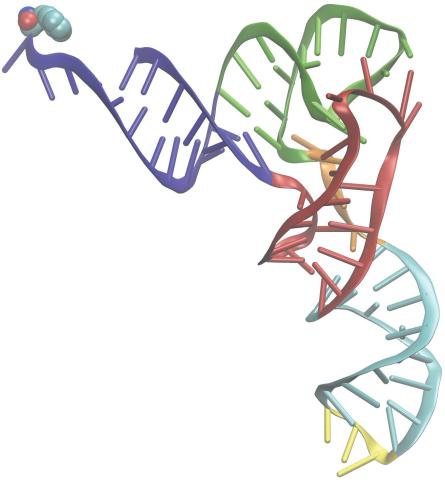
3406: Phenylalanine tRNA molecule
Phenylalanine tRNA showing the anticodon (yellow) and the amino acid, phenylalanine (blue and red spheres).
Patrick O'Donoghue and Dieter Soll, Yale University
View Media
3422: Atomic Structure of Poppy Enzyme
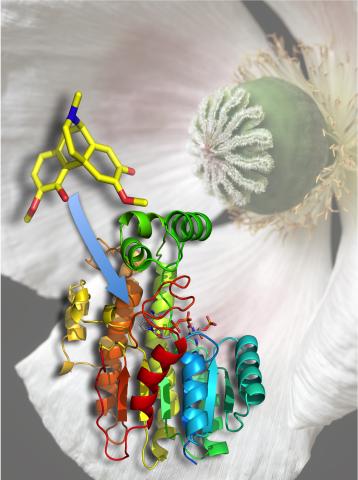
3422: Atomic Structure of Poppy Enzyme
The atomic structure of the morphine biosynthetic enzyme salutaridine reductase bound to the cofactor NADPH. The substrate salutaridine is shown entering the active site.
Judy Coyle, Donald Danforth Plant Science Center
View Media
3361: A2A adenosine receptor
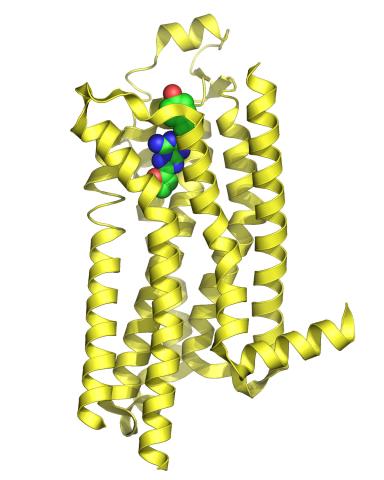
3361: A2A adenosine receptor
The receptor is shown bound to an inverse agonist, ZM241385.
Raymond Stevens, The Scripps Research Institute
View Media

2502: Focal adhesions
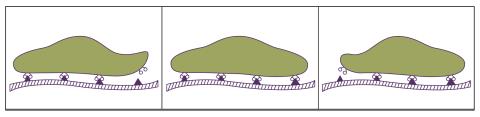
2502: Focal adhesions
Cells walk along body surfaces via tiny "feet," called focal adhesions, that connect with the extracellular matrix. See image 2503 for a labeled version of this illustration.
Crabtree + Company
View Media
3766: TFIID complex binds DNA to start gene transcription
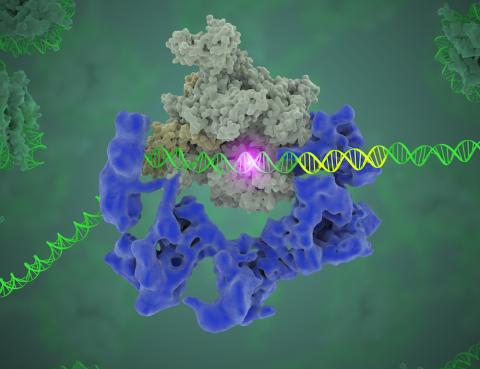
3766: TFIID complex binds DNA to start gene transcription
Gene transcription is a process by which the genetic information encoded in DNA is transcribed into RNA. It's essential for all life and requires the activity of proteins, called transcription factors, that detect where in a DNA strand transcription should start. In eukaryotes (i.e., those that have a nucleus and mitochondria), a protein complex comprising 14 different proteins is responsible for sniffing out transcription start sites and starting the process. This complex, called TFIID, represents the core machinery to which an enzyme, named RNA polymerase, can bind to and read the DNA and transcribe it to RNA. Scientists have used cryo-electron microscopy (cryo-EM) to visualize the TFIID-RNA polymerase-DNA complex in unprecedented detail. In this illustration, TFIID (blue) contacts the DNA and recruits the RNA polymerase (gray) for gene transcription. The start of the transcribed gene is shown with a flash of light. To learn more about the research that has shed new light on gene transcription, see this news release from Berkeley Lab. Related to video 5730.
Eva Nogales, Berkeley Lab
View Media
3732: A molecular interaction network in yeast 2
3732: A molecular interaction network in yeast 2
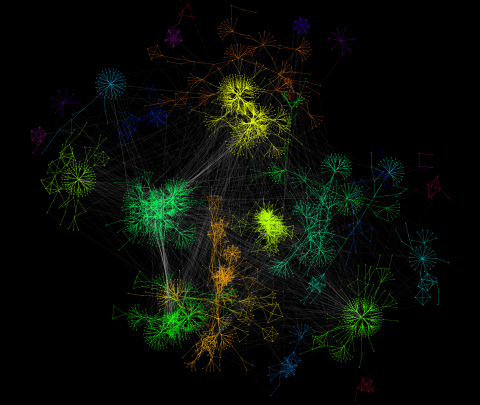
The image visualizes a part of the yeast molecular interaction network. The lines in the network represent connections among genes (shown as little dots) and different-colored networks indicate subnetworks, for instance, those in specific locations or pathways in the cell. Researchers use gene or protein expression data to build these networks; the network shown here was visualized with a program called Cytoscape. By following changes in the architectures of these networks in response to altered environmental conditions, scientists can home in on those genes that become central "hubs" (highly connected genes), for example, when a cell encounters stress. They can then further investigate the precise role of these genes to uncover how a cell's molecular machinery deals with stress or other factors. Related to images 3730 and 3733.
Keiichiro Ono, UCSD
View Media
3434: Flu virus proteins during self-replication
3434: Flu virus proteins during self-replication
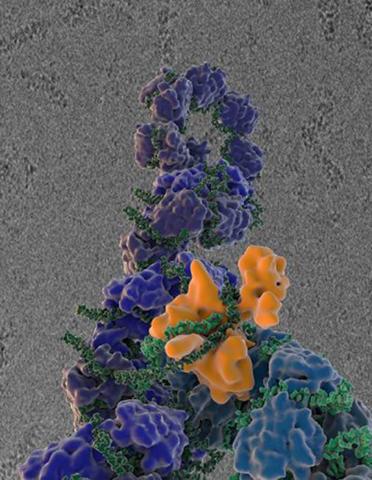
Influenza (flu) virus proteins in the act of self-replication. Viral nucleoprotein (blue) encapsidates [encapsulates] the RNA genome (green). The influenza virus polymerase (orange) reads and copies the RNA genome. In the background is an image of influenza virus ribonucleoprotein complexes observed using cryo-electron microscopy. This image is from a November 2012 News Release.
Scripps Research Institute in La Jolla, CA
View Media
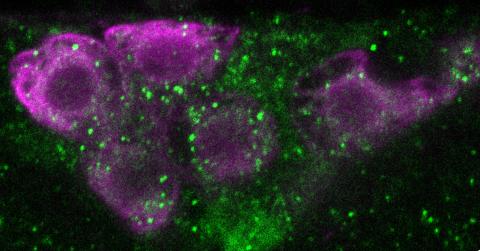
6890: Microtubules in hippocampal neurons
6890: Microtubules in hippocampal neurons
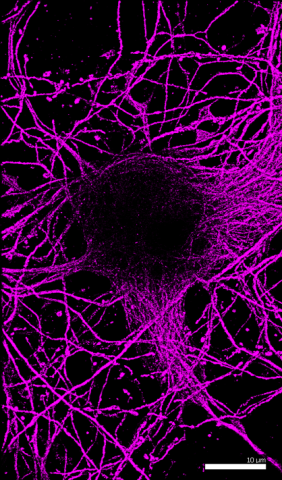
Microtubules (magenta) in neurons of the hippocampus, a part of the brain involved in learning and memory. Microtubules are strong, hollow fibers that provide structural support to cells. This image was captured using Stochastic Optical Reconstruction Microscopy (STORM).
Related to images 6889, 6891, and 6892.
Related to images 6889, 6891, and 6892.
Melike Lakadamyali, Perelman School of Medicine at the University of Pennsylvania.
View Media
2369: Protein purification robot in action 01
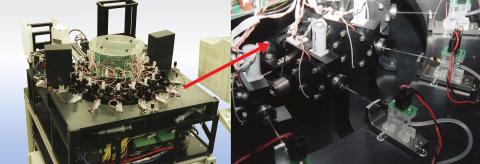
2369: Protein purification robot in action 01
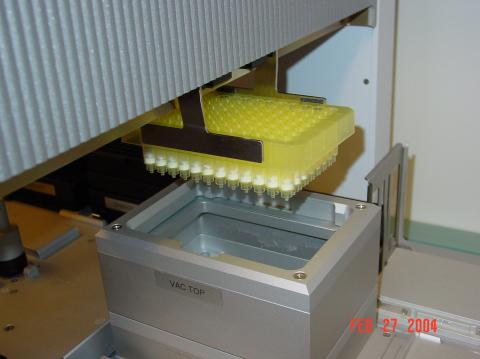
A robot is transferring 96 purification columns to a vacuum manifold for subsequent purification procedures.
The Northeast Collaboratory for Structural Genomics
View Media
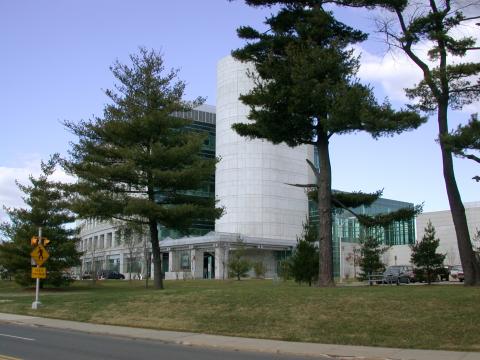
1082: Natcher Building 02
1082: Natcher Building 02
NIGMS staff are located in the Natcher Building on the NIH campus.
Alisa Machalek, National Institute of General Medical Sciences
View Media
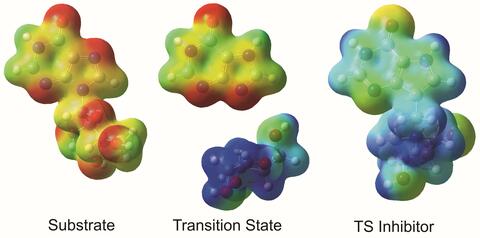
3429: Enzyme transition states
3429: Enzyme transition states
The molecule on the left is an electrostatic potential map of the van der Waals surface of the transition state for human purine nucleoside phosphorylase. The colors indicate the electron density at any position of the molecule. Red indicates electron-rich regions with negative charge and blue indicates electron-poor regions with positive charge. The molecule on the right is called DADMe-ImmH. It is a chemically stable analogue of the transition state on the left. It binds to the enzyme millions of times tighter than the substrate. This inhibitor is in human clinical trials for treating patients with gout. This image appears in Figure 4, Schramm, V.L. (2011) Annu. Rev. Biochem. 80:703-732.
Vern Schramm, Albert Einstein College of Medicine of Yeshiva University
View Media
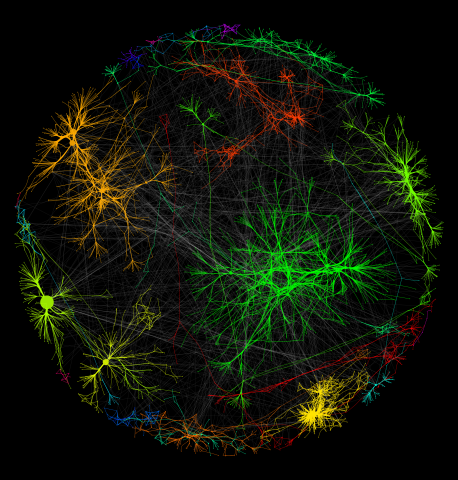
3730: A molecular interaction network in yeast 1
3730: A molecular interaction network in yeast 1
The image visualizes a part of the yeast molecular interaction network. The lines in the network represent connections among genes (shown as little dots) and different-colored networks indicate subnetworks, for instance, those in specific locations or pathways in the cell. Researchers use gene or protein expression data to build these networks; the network shown here was visualized with a program called Cytoscape. By following changes in the architectures of these networks in response to altered environmental conditions, scientists can home in on those genes that become central "hubs" (highly connected genes), for example, when a cell encounters stress. They can then further investigate the precise role of these genes to uncover how a cell's molecular machinery deals with stress or other factors. Related to images 3732 and 3733.
Keiichiro Ono, UCSD
View Media
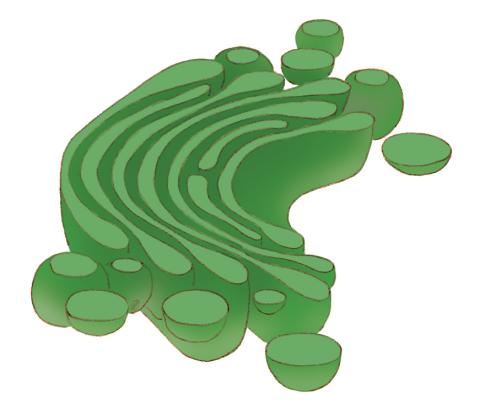
1275: Golgi
1275: Golgi
The Golgi complex, also called the Golgi apparatus or, simply, the Golgi. This organelle receives newly made proteins and lipids from the ER, puts the finishing touches on them, addresses them, and sends them to their final destinations.
Judith Stoffer
View Media
3254: Pulsating response to stress in bacteria - video
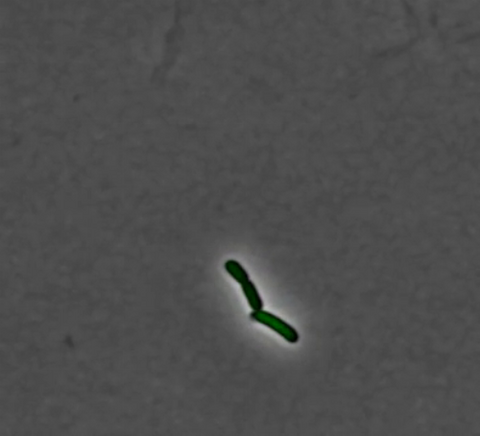
3254: Pulsating response to stress in bacteria - video
By attaching fluorescent proteins to the genetic circuit responsible for B. subtilis's stress response, researchers can observe the cells' pulses as green flashes. This video shows flashing cells as they multiply over the course of more than 12 hours. In response to a stressful environment like one lacking food, B. subtilis activates a large set of genes that help it respond to the hardship. Instead of leaving those genes on as previously thought, researchers discovered that the bacteria flip the genes on and off, increasing the frequency of these pulses with increasing stress. See entry 3253 for a related still image.
Michael Elowitz, Caltech University
View Media
2604: Induced stem cells from adult skin 02
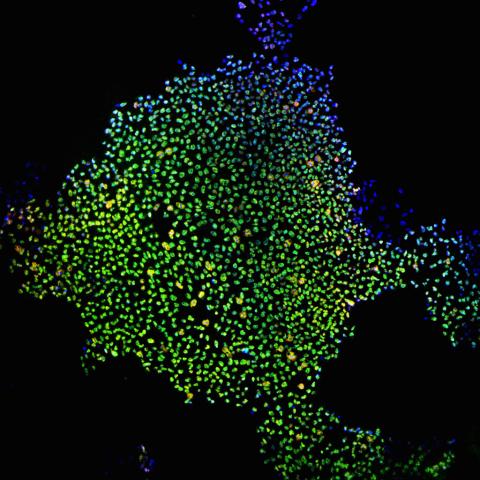
2604: Induced stem cells from adult skin 02
These cells are induced stem cells made from human adult skin cells that were genetically reprogrammed to mimic embryonic stem cells. The induced stem cells were made potentially safer by removing the introduced genes and the viral vector used to ferry genes into the cells, a loop of DNA called a plasmid. The work was accomplished by geneticist Junying Yu in the laboratory of James Thomson, a University of Wisconsin-Madison School of Medicine and Public Health professor and the director of regenerative biology for the Morgridge Institute for Research.
James Thomson, University of Wisconsin-Madison
View Media
2507: Carbon building blocks (with examples)
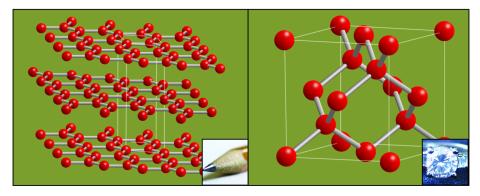
2507: Carbon building blocks (with examples)
The arrangement of identical molecular components can make a dramatic difference. For example, carbon atoms can be arranged into dull graphite (left) or sparkly diamonds (right). See image 2506 for an illustration without examples.
Crabtree + Company
View Media
2808: Cell proliferation in a quail embryo
2808: Cell proliferation in a quail embryo
Image showing that the edge zone (top of image) of the quail embryo shows no proliferating cells (cyan), unlike the interior zone (bottom of image). Non-proliferating cell nuclei are labeled green. This image was obtained as part of a study to understand cell migration in embryos. More specifically, cell proliferation at the edge of the embryo was studied by examining the cellular uptake of a chemical compound called BrDU, which incorporates into the DNA during the S-phase of the cell cycle. Here, the cells that are positive for BrDU uptake are labeled in cyan, while other non-proliferating cell nuclei are labeled green. Notice that the vast majority of BrDU+ cells are located far away from the edge, indicating that edge cells are mostly non-proliferating. An NIGMS grant to Professor Garcia was used to purchase the confocal microscope that collected this image. Related to image 2807 and video 2809.
Andrés Garcia, Georgia Tech
View Media
3390: NCMIR Intestine-2
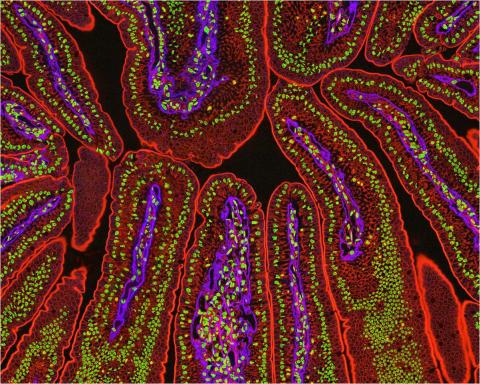
3390: NCMIR Intestine-2
The small intestine is where most of our nutrients from the food we eat are absorbed into the bloodstream. The walls of the intestine contain small finger-like projections called villi which increase the organ's surface area, enhancing nutrient absorption. It consists of the duodenum, which connects to the stomach, the jejenum and the ileum, which connects with the large intestine. Related to image 3389.
Tom Deerinck, National Center for Microscopy and Imaging Research (NCMIR)
View Media
2299: 2-D NMR
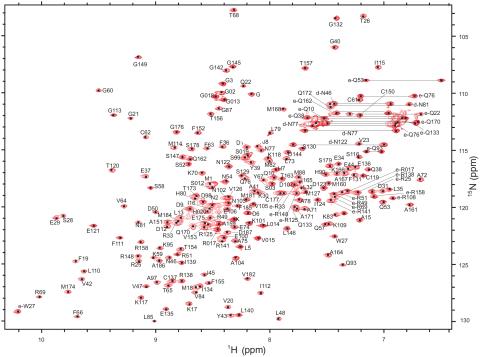
2299: 2-D NMR
A two-dimensional NMR spectrum of a protein, in this case a 2D 1H-15N HSQC NMR spectrum of a 228 amino acid DNA/RNA-binding protein.
Dr. Xiaolian Gao's laboratory at the University of Houston
View Media
3251: Spinal nerve cells
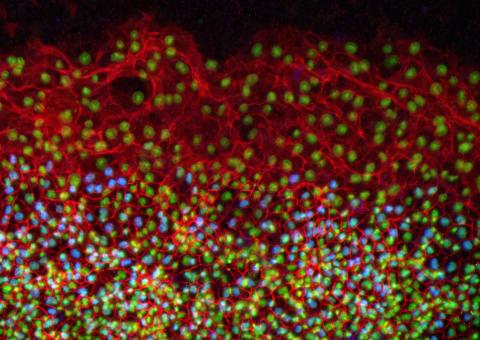
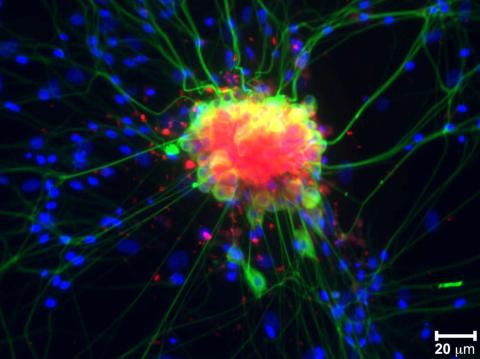
3251: Spinal nerve cells
Neurons (green) and glial cells from isolated dorsal root ganglia express COX-2 (red) after exposure to an inflammatory stimulus (cell nuclei are blue). Lawrence Marnett and colleagues have demonstrated that certain drugs selectively block COX-2 metabolism of endocannabinoids -- naturally occurring analgesic molecules -- in stimulated dorsal root ganglia. Featured in the October 20, 2011 issue of Biomedical Beat.
Lawrence Marnett, Vanderbilt University
View Media
5888: Independence Day
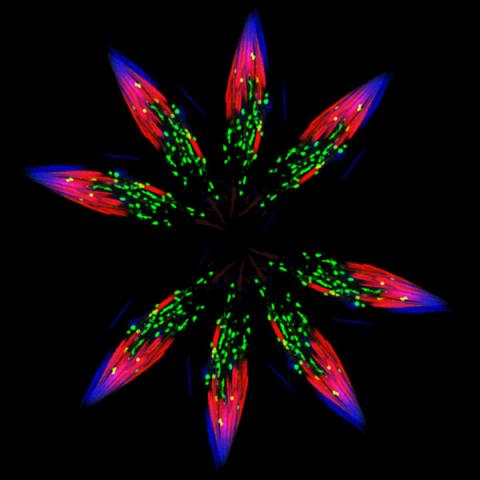
5888: Independence Day
This graphic that resembles a firework was created from a picture of a fruit fly spermatid. This fruit fly spermatid recycles various molecules, including malformed or damaged proteins. Actin filaments (red) in the cell draw unwanted proteins toward a barrel-shaped structure called the proteasome (green clusters), which degrades the molecules into their basic parts for re-use.
Sigi Benjamin-Hong, Rockefeller University
View Media
2357: Capillary protein crystallization robot
2357: Capillary protein crystallization robot
This ACAPELLA robot for capillary protein crystallization grows protein crystals, freezes them, and centers them without manual intervention. The close-up is a view of one of the dispensers used for dispensing proteins and reagents.
Structural Genomics of Pathogenic Protozoa Consortium
View Media
2368: Mounting of protein crystals
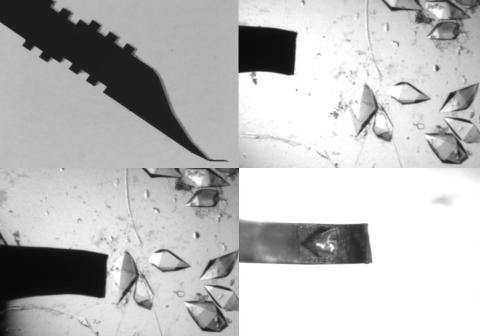
2368: Mounting of protein crystals
Automated methods using micromachined silicon are used at the Northeast Collaboratory for Structural Genomics to mount protein crystals for X-ray crystallography.
The Northeast Collaboratory for Structural Genomics
View Media

2690: Dolly the sheep
2690: Dolly the sheep
Scientists in Scotland were the first to clone an animal, this sheep named Dolly. She later gave birth to Bonnie, the lamb next to her.
View Media
6538: Pathways: The Fascinating Cells of Research Organisms
6538: Pathways: The Fascinating Cells of Research Organisms
Learn how research organisms, such as fruit flies and mice, can help us understand and treat human diseases. Discover more resources from NIGMS’ Pathways collaboration with Scholastic. View the video on YouTube for closed captioning.
National Institute of General Medical Sciences
View Media
2578: Cellular aging
2578: Cellular aging
A protein called tubulin (green) accumulates in the center of a nucleus (outlined in pink) from an aging cell. Normally, this protein is kept out of the nucleus with the help of gatekeepers known as nuclear pore complexes. But NIGMS-funded researchers found that wear and tear to long-lived components of the complexes eventually lowers the gatekeepers' guard. As a result, cytoplasmic proteins like tubulin gain entry to the nucleus while proteins normally confined to the nucleus seep out. The work suggests that finding ways to stop the leakage could slow the cellular aging process and possibly lead to new therapies for age-related diseases.
Maximiliano D'Angelo and Martin Hetzer, Salk Institute
View Media
6982: Insulin production and fat sensing in fruit flies
6982: Insulin production and fat sensing in fruit flies
Fourteen neurons (magenta) in the adult Drosophila brain produce insulin, and fat tissue sends packets of lipids to the brain via the lipoprotein carriers (green). This image was captured using a confocal microscope and shows a maximum intensity projection of many slices.
Related to images 6983, 6984, and 6985.
Related to images 6983, 6984, and 6985.
Akhila Rajan, Fred Hutchinson Cancer Center
View Media
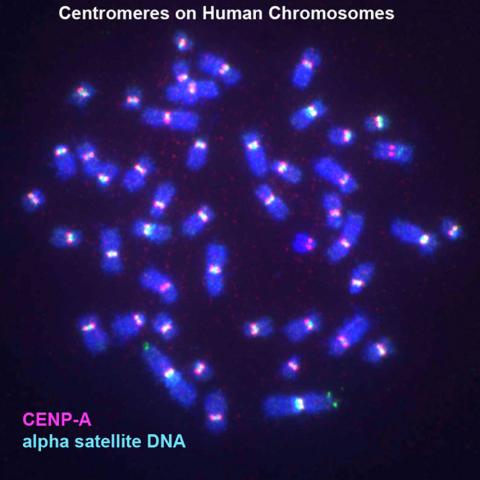
3255: Centromeres on human chromosomes
3255: Centromeres on human chromosomes
Human metaphase chromosomes are visible with fluorescence in vitro hybridization (FISH). Centromeric alpha satellite DNA (green) are found in the heterochromatin at each centromere. Immunofluorescence with CENP-A (red) shows the centromere-specific histone H3 variant that specifies the kinetochore.
Peter Warburton, Mount Sinai School of Medicine
View Media
3391: Protein folding video
3391: Protein folding video
Proteins are long chains of amino acids. Each protein has a unique amino acid sequence. It is still a mystery how a protein folds into the proper shape based on its sequence. Scientists hope that one day they can "watch" this folding process for any given protein. The dream has been realized, at least partially, through the use of computer simulation.
Theoretical and Computational Biophysics Group
View Media
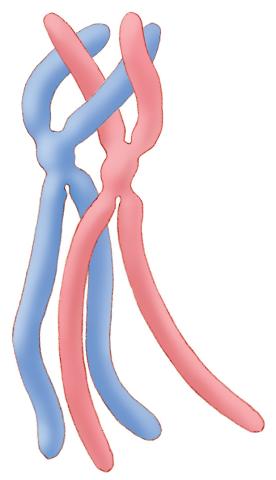
1315: Chromosomes before crossing over
1315: Chromosomes before crossing over
Duplicated pair of chromosomes lined up and ready to cross over.
Judith Stoffer
View Media
3599: Skin cell (keratinocyte)
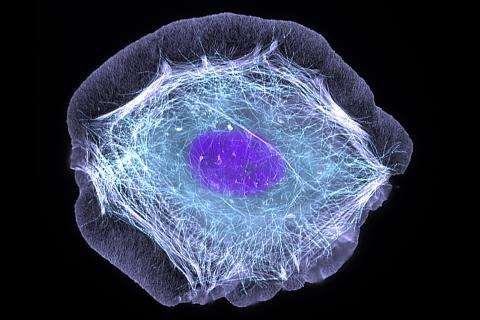
3599: Skin cell (keratinocyte)
This normal human skin cell was treated with a growth factor that triggered the formation of specialized protein structures that enable the cell to move. We depend on cell movement for such basic functions as wound healing and launching an immune response.
This image was part of the Life: Magnified exhibit that ran from June 3, 2014, to January 21, 2015, at Dulles International Airport.
This image was part of the Life: Magnified exhibit that ran from June 3, 2014, to January 21, 2015, at Dulles International Airport.
Torsten Wittmann, University of California, San Francisco
View Media
2558: RNA interference
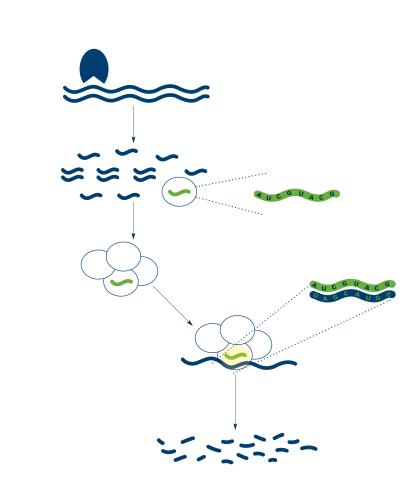
2558: RNA interference
RNA interference or RNAi is a gene-silencing process in which double-stranded RNAs trigger the destruction of specific RNAs. See 2559 for a labeled version of this illustration. Featured in The New Genetics.
Crabtree + Company
View Media
2350: Mandelate racemase from B. subtilis
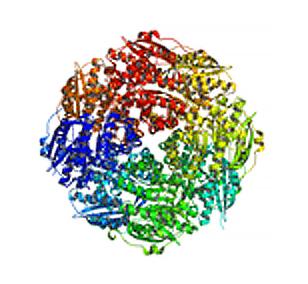
2350: Mandelate racemase from B. subtilis
Model of the mandelate racemase enzyme from Bacillus subtilis, a bacterium commonly found in soil.
New York Structural GenomiX Research Consortium, PSI
View Media
6532: Mosaicism in C. elegans (Black Background)
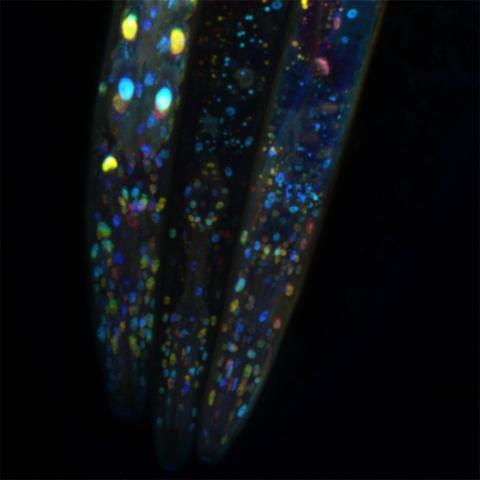
6532: Mosaicism in C. elegans (Black Background)
In the worm C. elegans, double-stranded RNA made in neurons can silence matching genes in a variety of cell types through the transport of RNA between cells. The head region of three worms that were genetically modified to express a fluorescent protein were imaged and the images were color-coded based on depth. The worm on the left lacks neuronal double-stranded RNA and thus every cell is fluorescent. In the middle worm, the expression of the fluorescent protein is silenced by neuronal double-stranded RNA and thus most cells are not fluorescent. The worm on the right lacks an enzyme that amplifies RNA for silencing. Surprisingly, the identities of the cells that depend on this enzyme for gene silencing are unpredictable. As a result, worms of identical genotype are nevertheless random mosaics for how the function of gene silencing is carried out. For more, see journal article and press release. Related to image 6534.
Snusha Ravikumar, Ph.D., University of Maryland, College Park, and Antony M. Jose, Ph.D., University of Maryland, College Park
View Media
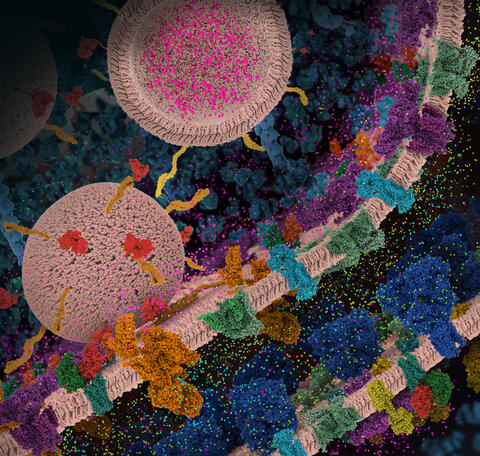
6992: Molecular view of glutamatergic synapse
6992: Molecular view of glutamatergic synapse
This illustration highlights spherical pre-synaptic vesicles that carry the neurotransmitter glutamate. The presynaptic and postsynaptic membranes are shown with proteins relevant for transmitting and modulating the neuronal signal.
PDB 101’s Opioids and Pain Signaling video explains how glutamatergic synapses are involved in the process of pain signaling.
PDB 101’s Opioids and Pain Signaling video explains how glutamatergic synapses are involved in the process of pain signaling.
Amy Wu and Christine Zardecki, RCSB Protein Data Bank.
View Media
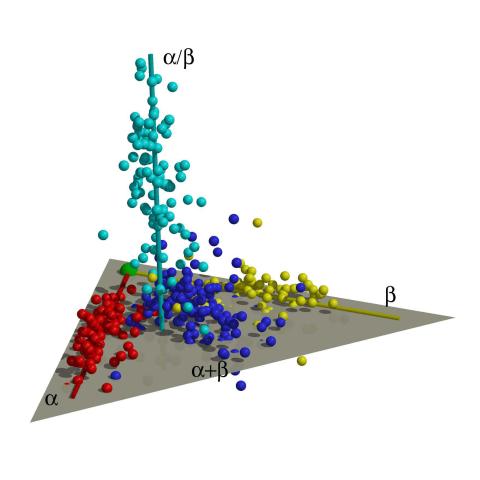
2365: Map of protein structures 01
2365: Map of protein structures 01
A global "map of the protein structure universe." The Berkeley Structural Genomics Center has developed a method to visualize the vast universe of protein structures in which proteins of similar structure are located close together and those of different structures far away in the space. This map, constructed using about 500 of the most common protein folds, reveals a highly non-uniform distribution, and shows segregation between four elongated regions corresponding to four different protein classes (shown in four different colors). Such a representation reveals a high-level of organization of the protein structure universe.
Berkeley Structural Genomics Center, PSI
View Media
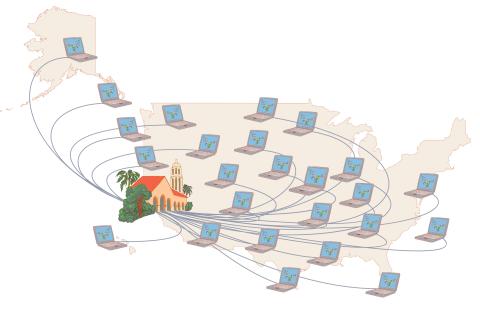
1276: Folding@Home
1276: Folding@Home
Stanford University scientist Vijay Pande decided to couple the power of computers with the help of the public. He initiated a project called Folding@Home, a so-called distributed computing project in which anyone who wants to can download a screensaver that performs protein-folding calculations when a computer is not in use. Folding@Home is modeled on a similar project called SETI@Home, which is used to search for extraterrestrial intelligence.
Judith Stoffer
View Media
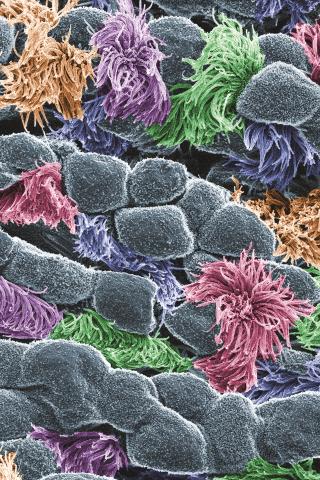
3646: Cells lining the trachea
3646: Cells lining the trachea
In this image, viewed with a ZEISS ORION NanoFab microscope, the community of cells lining a mouse airway is magnified more than 10,000 times. This collection of cells, known as the mucociliary escalator, is also found in humans. It is our first line of defense against inhaled bacteria, allergens, pollutants, and debris. Malfunctions in the system can cause or aggravate lung infections and conditions such as asthma and chronic obstructive pulmonary disease. The cells shown in gray secrete mucus, which traps inhaled particles. The colored cells sweep the mucus layer out of the lungs.
This image was part of the Life: Magnified exhibit that ran from June 3, 2014, to January 21, 2015, at Dulles International Airport.
This image was part of the Life: Magnified exhibit that ran from June 3, 2014, to January 21, 2015, at Dulles International Airport.
Eva Mutunga and Kate Klein, University of the District of Columbia and National Institute of Standards and Technology
View Media
1018: Lily mitosis 12
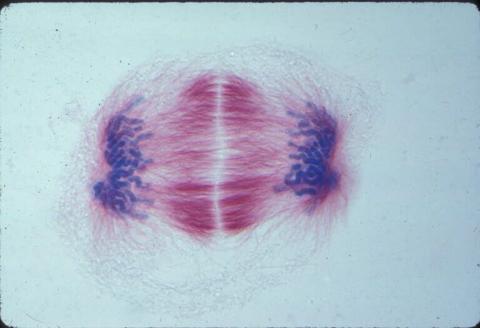
1018: Lily mitosis 12
A light microscope image of a cell from the endosperm of an African globe lily (Scadoxus katherinae). This is one frame of a time-lapse sequence that shows cell division in action. The lily is considered a good organism for studying cell division because its chromosomes are much thicker and easier to see than human ones. Staining shows microtubules in red and chromosomes in blue. Here, condensed chromosomes are clearly visible near the end of a round of mitosis.
Related to images 1010, 1011, 1012, 1013, 1014, 1015, 1016, 1017, 1019, and 1021.
Related to images 1010, 1011, 1012, 1013, 1014, 1015, 1016, 1017, 1019, and 1021.
Andrew S. Bajer, University of Oregon, Eugene
View Media
7000: Plastic-eating enzymes
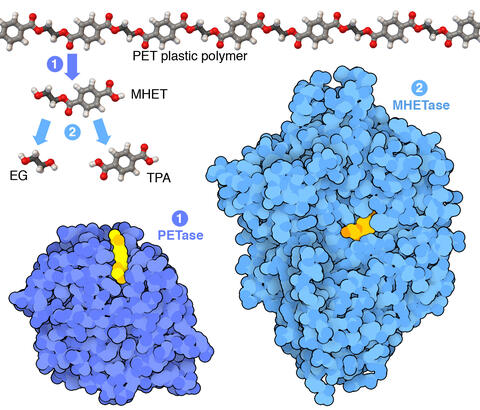
7000: Plastic-eating enzymes
PETase enzyme degrades polyester plastic (polyethylene terephthalate, or PET) into monohydroxyethyl terephthalate (MHET). Then, MHETase enzyme degrades MHET into its constituents ethylene glycol (EG) and terephthalic acid (TPA).
Find these in the RCSB Protein Data Bank: PET hydrolase (PDB entry 5XH3) and MHETase (PDB entry 6QGA).
Find these in the RCSB Protein Data Bank: PET hydrolase (PDB entry 5XH3) and MHETase (PDB entry 6QGA).
Amy Wu and Christine Zardecki, RCSB Protein Data Bank.
View Media
6755: Honeybee brain
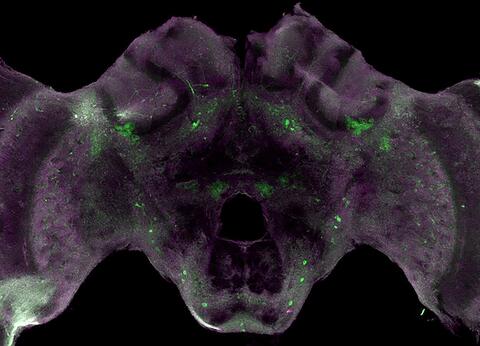
6755: Honeybee brain
Insect brains, like the honeybee brain shown here, are very different in shape from human brains. Despite that, bee and human brains have a lot in common, including many of the genes and neurochemicals they rely on in order to function. The bright-green spots in this image indicate the presence of tyrosine hydroxylase, an enzyme that allows the brain to produce dopamine. Dopamine is involved in many important functions, such as the ability to experience pleasure. This image was captured using confocal microscopy.
Gene Robinson, University of Illinois at Urbana-Champaign.
View Media