
Image Gallery: Symmetrically and asymmetrically elongating cells
ID
3648
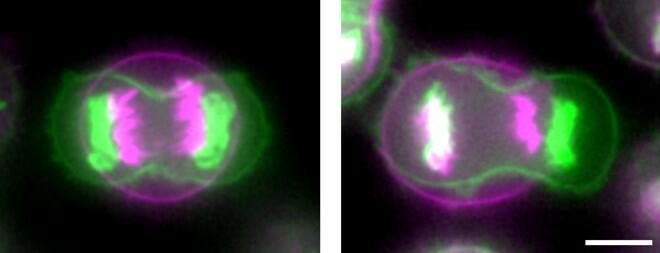
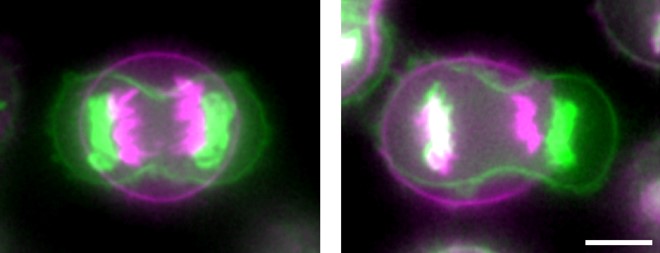
Merged fluorescent images of symmetrically (left) or asymmetrically (right) elongating HeLa cells at the end of early anaphase (magenta) and late anaphase (green). Chromosomes and cortical actin are visualized by expressing mCherry-histone H2B and Lifeact-mCherry. Scale bar, 10µm. See the PubMed abstract of this research.
Source
Tomomi Kiyomitsu and Iain M. Cheeseman, Whitehead Institute for Biomedical Research


