
Image Gallery: Protein map
ID
2423
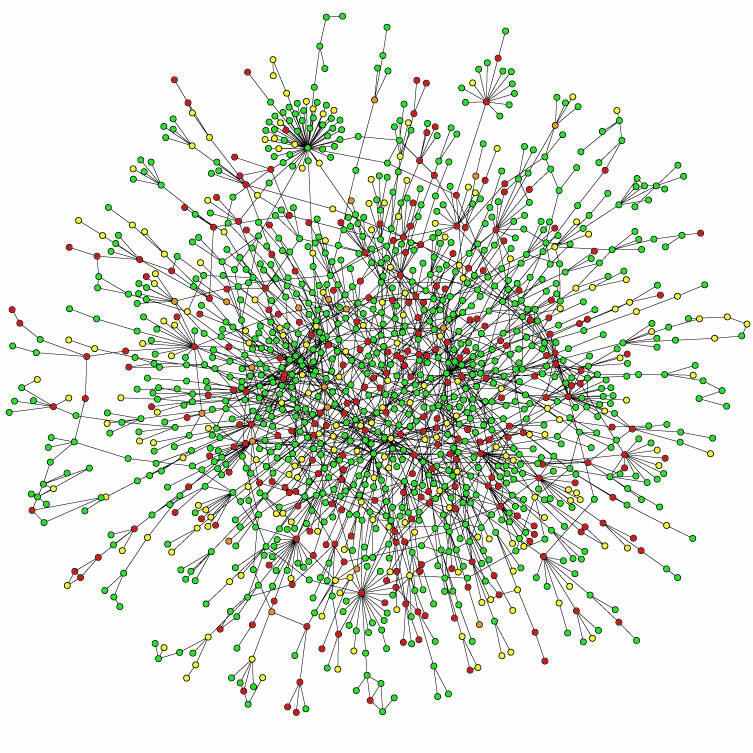
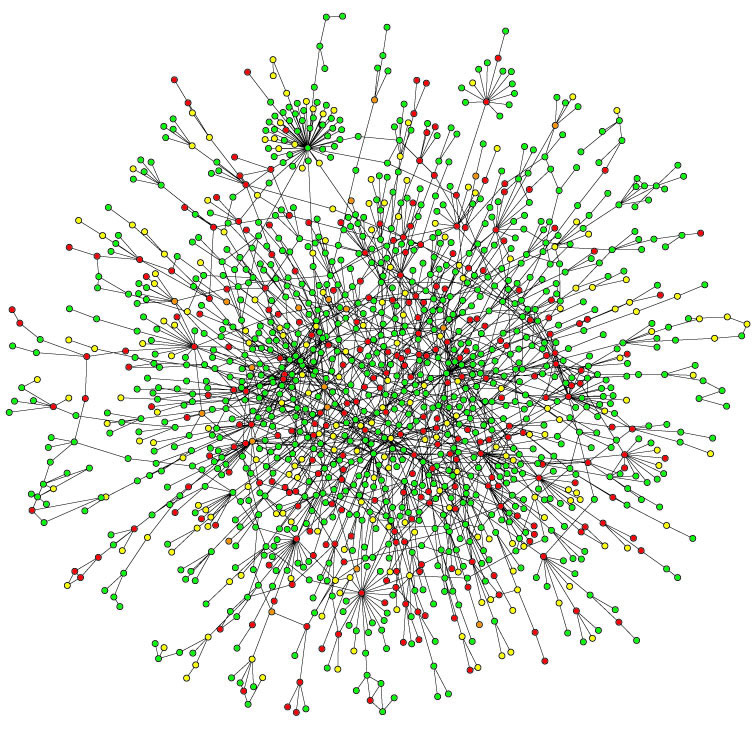
Network diagram showing a map of protein-protein interactions in a yeast (Saccharomyces cerevisiae) cell. This cluster includes 78 percent of the proteins in the yeast proteome. The color of a node represents the phenotypic effect of removing the corresponding protein (red, lethal; green, nonlethal; orange, slow growth; yellow, unknown).
Source
Hawoong Jeong, KAIST, Korea
Topics