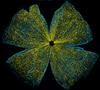
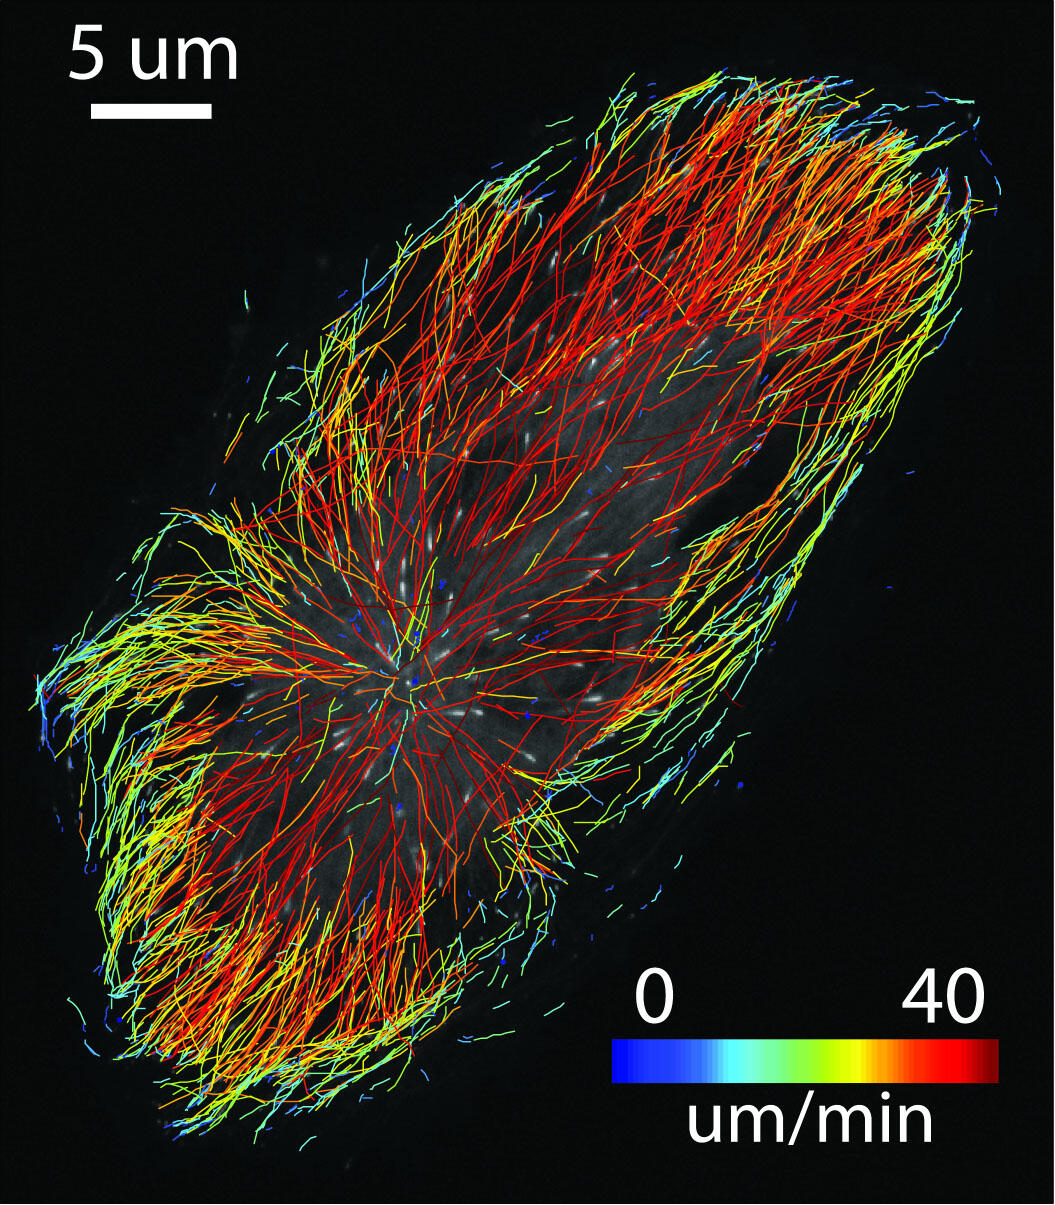
Image Gallery: Microtubule growth Image Download Full Quality (0.5MB) ID 2800 Map of microtubule growth rates. Rates are color coded. This is an example of NIH-supported research on single-cell analysis. Related to 2798 , 2799, 2801, 2802 and 2803. Source Gaudenz Danuser, Harvard Medical School Topics Cells
