
Image Gallery: Brain waves of a patient anesthetized with propofol

ID
6779
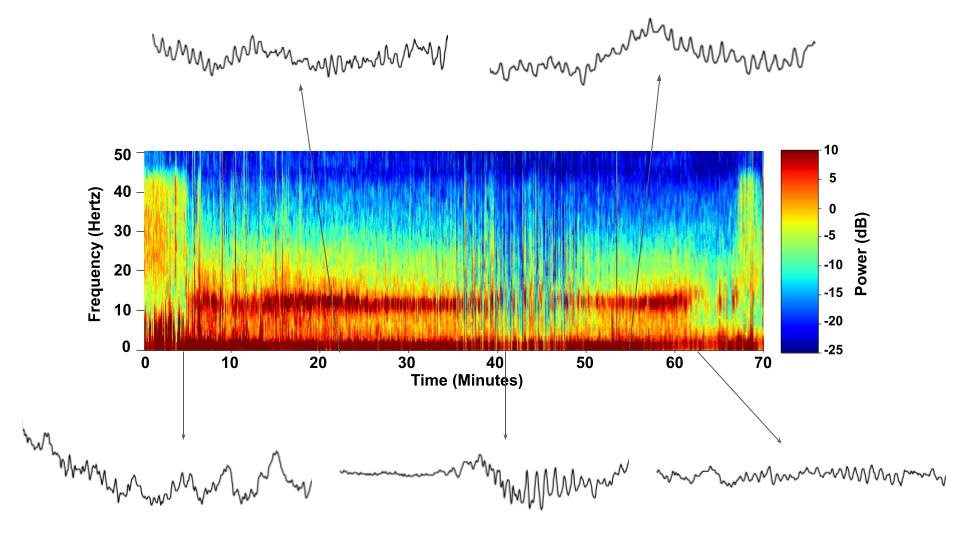
A representation of a patient’s brain waves after receiving the anesthetic propofol. All anesthetics create brain wave changes that vary depending on the patient’s age and the type and dose of anesthetic used. These changes are visible in raw electroencephalogram (EEG) readings, but they’re easier to interpret using a spectrogram where the signals are broken down by time (x-axis), frequency (y-axis), and power (color scale). This spectrogram shows the changes in brain waves before, during, and after propofol-induced anesthesia. The patient is unconscious from minute 5, upon propofol administration, through minute 69 (change in power and frequency). But, between minutes 35 and 48, the patient fell into a profound state of unconsciousness (disappearance of dark red oscillations between 8 to 12 Hz), which required the anesthesiologist to adjust the rate of propofol administration. The propofol was stopped at minute 62 and the patient woke up around minute 69.
Source
Emery N. Brown, M.D., Ph.D., Massachusetts General Hospital/Harvard Medical School, Picower Institute for Learning and Memory, and Massachusetts Institute of Technology.


