
Image Gallery: Mapping disease spread

ID
2320
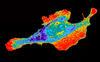
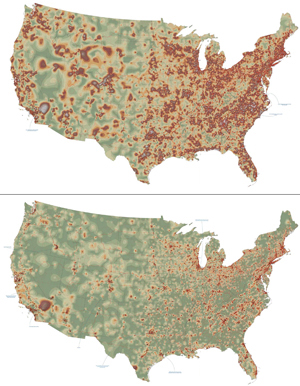
How far and fast an infectious disease spreads across a community depends on many factors, including transportation. These U.S. maps, developed as part of an international study to simulate and analyze disease spread, chart daily commuting patterns. They show where commuters live (top) and where they travel for work (bottom). Green represents the fewest number of people whereas orange, brown, and white depict the most. Such information enables researchers and policymakers to visualize how an outbreak in one area can spread quickly across a geographic region.
Source
David Chrest, RTI International
Topics


