This page is historical material reflecting the Feedback Loop Blog as it existed on
May 6, 2016. This page is no longer updated and links to external websites
and some internal pages may not work.
May 6, 2016
Archived: Distribution of NIGMS R01 Award Sizes
We have published median and mean direct cost award amounts for R01 grants, but these statistical aggregates can mask variations present in our grant portfolio. In this analysis, we illuminate two major differences in R01 award size distributions: those between single-principal investigator (PI) and multiple-PI (MPI) grants and those between new and competing renewal grants. It is worth noting that the numbers are per award values rather than the total NIGMS support provided to investigators and that award size can also be influenced by NIH-wide policies and NIGMS-specific policies that promote the consideration of multiple factors in making funding decisions.
The first major distinction in NIGMS R01s exists between single-PI and MPI awards. NIH has allowed applications that identify more than one PI since Fiscal Year 2007. Many MPI applications request, and receive, larger amounts of funding than do typical single-PI applications. As shown in Figure 1, single-PI awards have a size peak in the range of $175,000-200,000 in direct costs (funds typically directly associated with the research project rather than overhead costs), while MPI awards tend to have larger budgets and a broader size distribution. MPI awards are, on average, approximately 25% larger for each additional PI (data not shown).
The second major distinction in NIGMS R01s exists between new and competing renewal grants. As referenced in previous Feedback Loop funding trends posts, NIGMS has a strong interest in promoting the entry of new and early stage investigators (NI/ESI) into biomedical research. One aspect of this is ensuring that these investigators have adequate support to conduct their research. While it is true that established investigators (EI) have larger R01 award sizes, most of the difference can be attributed to competing renewal awards to EIs, as shown in Figure 2. Award size also increases as a function of the age of the grant, roughly 4% larger per renewal (data not shown).
EDITOR’S NOTE: We added the following figures on May 25, 2016.
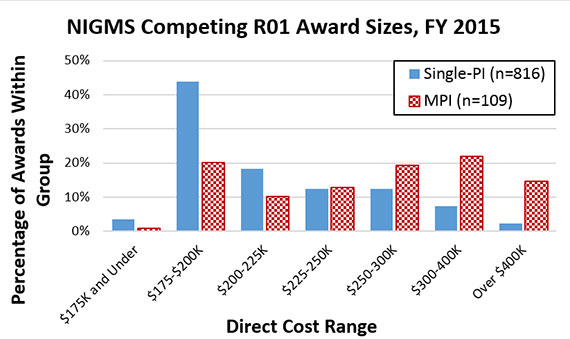
Figure 1. Distribution of NIGMS Competing R01 Award Direct Costs by Principal Investigator Status, Fiscal Year 2015. Awards are separated into two groups: single-PI awards (solid blue bars, n=816) and MPI awards (checkered red bars, n=109). Single-PI awards are most prevalent in the $175,000-200,000 direct cost range and taper significantly as direct costs increase. MPI awards have peaks in the $175,000-200,000 and $300,000-400,000 direct cost ranges.
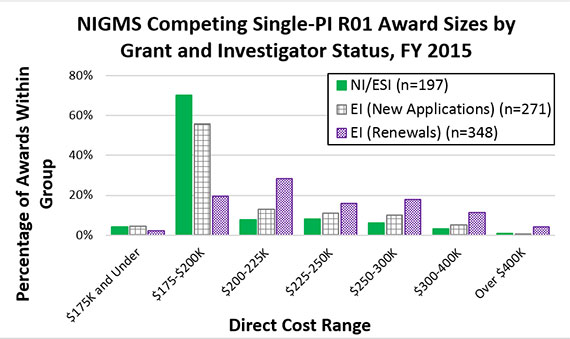
Figure 2. Distribution of NIGMS Competing Single-PI R01 Award Direct Costs by New/Renewal and Principal Investigator Status, Fiscal Year 2015. Direct cost distributions are shown for three categories: awards to NI/ESIs (solid green bars, n=197), new awards to EIs (gridded gray bars, n=271) and competing renewal awards to EIs (checkered purple bars, n=348). New awards to NI/ESI and EI groups have similar direct cost distributions, peaking at $175,000-200,000 with a small percentage of EI awards receiving more funds than NI/ESI awards. The competing renewal awards to EIs have a peak in the $200,000-225,000 range and are larger than new awards to either investigator group.
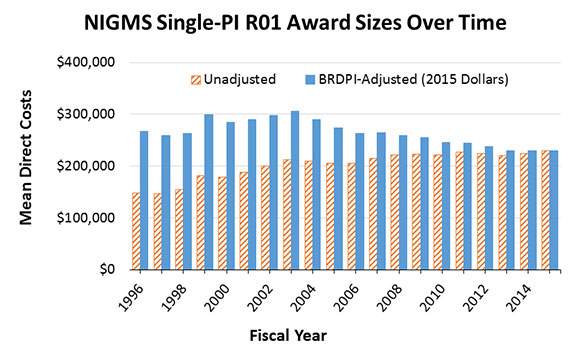
Figure 3. History of NIGMS Single-PI R01 Award Sizes With Inflation Adjustments, Fiscal Years 1996-2015. Mean direct costs for NIGMS single-PI R01 awards over time are displayed, both as unadjusted values (diagonal orange lines) and as inflation-adjusted values (solid blue lines). Inflation adjustments were made using the Biomedical Research and Development Price Index (BRDPI) and were calibrated to reflect buying power in Fiscal Year 2015. As shown in the figure, the unadjusted size of an average NIGMS single-PI R01 has increased by 56% over this time period, but the buying power of the award has decreased by 14%.
About the Authors