This page is historical material reflecting the Feedback Loop Blog as it existed on
April 20, 2016. This page is no longer updated and links to external websites
and some internal pages may not work.
April 20, 2016
Archived: P01 Outcomes Analysis
As part of our program assessment process, we have analyzed NIGMS program project (P01) grants to improve our understanding of how their outcomes compare with those of other mechanisms.
The most recent NIGMS funding opportunity announcement for P01s states that individual projects “must be clearly interrelated and synergistic so that the research ideas, efforts, and outcomes of the program as a whole will offer a distinct advantage over pursuing the individual projects separately.” From this perspective, we sought to address three major questions:
To determine whether P01s achieve synergies beyond those of R01s, we looked for differences in both productivity, as measured by publications, and impact, as measured by two different citation metrics. For publications, because P01s generally have much larger budgets than do R01s and multiple-PI R01s, comparing total publication counts would be misleading. Therefore, we assessed the cost-effectiveness of publications for each of the three grant mechanisms normalized by years and award size. The results, shown in Figure 2, suggest that multiple-PI R01s outperformed both P01s and single-PI R01s in terms of cost-effectiveness of publications. The same holds true when publications are weighted by the number of grants they cite (data not shown) to control for funds contributed to a project from additional sources.
To assess whether P01s achieve synergies in terms of their impact, we looked at several different measures of impact. Figure 3 charts publications for both P01s and multiple-PI R01s in order of their citation percentile rank. An average distribution would be expected to have 1% of publications in the top 1% for citations, 10% in the top 10%, and so on. P01s had a greater proportion of highly cited publications than the average, with 5% of their publications in the top 1% of citations, 28% in the top 10% and 47% in the top 20%. Multiple-PI R01s had an even greater degree of enrichment in terms of highly cited publications, with 6% in the top 1%, 37% in the top 10% and a full 56% in the top 20%. In comparison, single-PI R01s had 4% of their publications in the top 1%, 29% in the top 10% and 47% in the top 20%--very similar to the values for P01s.
Although the citation percentile rank is normalized for field and year, there may still be concerns with comparing citations across different fields due to differing citation patterns, field sizes and other parameters. To address this potential issue, we applied another metric of impact known as the relative citation ratio (RCR), which allows for comparison across scientific areas. If the RCR equals 1, it means that the publication in question received the average number of citations as a publication in its field. If the RCR is less than 1, it means that the publication received fewer citations than the average, and if the RCR is greater than 1, it means that the publication received more citations than the average. Figure 4 plots the mean RCR for each grant by mechanism, showing there was no statistically significant difference in impact as measured by RCR.
To address the question of whether certain research areas require a P01, we examined the top fields in which papers arising from P01s and multiple-PI R01s were published (Figure 5). The results suggest that there is a great deal of overlap, at least in terms of these broad categories.
Although these analyses certainly do not answer every important question about the optimal ways to fund collaboration and team science, they provide data that will inform the Institute’s efforts to develop the most efficient and effective mechanisms and policies to support a broad, diverse and vibrant portfolio of fundamental biomedical research.
- Do P01s achieve synergies above and beyond a collection of separate grants?
- How do the results from P01s compare with those from R01s?
- Do certain fields of science need P01s more than others?
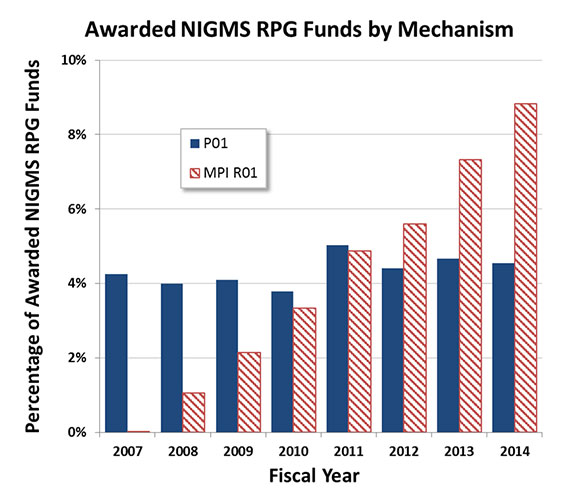
Figure 1. Percentage of Awarded NIGMS RPG Funds by Mechanism, Fiscal Years 2007-2014. The solid blue bars represent the percentage of NIGMS RPG funds awarded for P01s and the striped red bars represent the percentage of NIGMS RPG funds awarded for multiple-PI R01s.
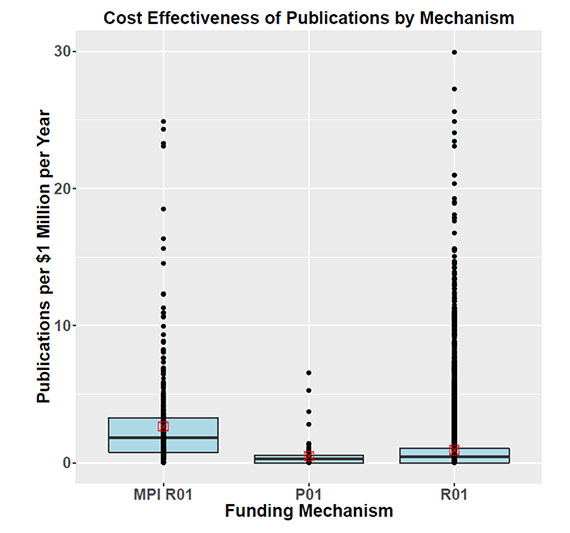
Figure 2. Publications per $1 Million per Year by Grant Mechanism. The rectangular blue boxes represent the interquartile range of each mechanism, the horizontal black lines represent the median, and the square red boxes represent the mean. The black dots aligned vertically represent the grants within each mechanism.
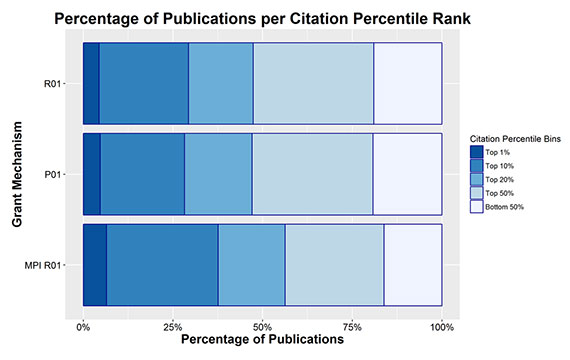
Figure 3. Percentage of Publications per Citation Percentile Rank by Mechanism. The dark to light bands from left to right represent the percentage of publications in the top 1%, 10%, 20% and 50%, as well as the bottom 50%, of publications by citation count (normalized for field and year). While both P01s and R01s produce a higher proportion of articles in the top 1%, 10%, 20% and 50% than the average distribution, multiple-PI R01s produce even more highly cited papers.
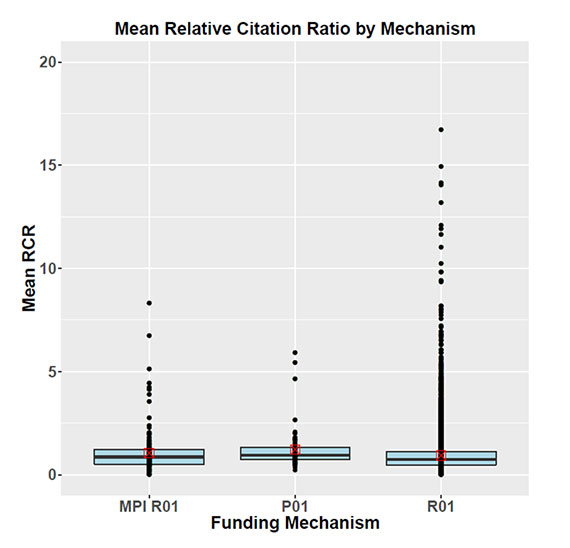
Figure 4. Mean Relative Citation Ratio by Funding Mechanism. The rectangular blue boxes represent the interquartile range of each mechanism, the horizontal black lines represent the median, and the square red boxes represent the mean. The black dots aligned vertically represent the grants within each mechanism.
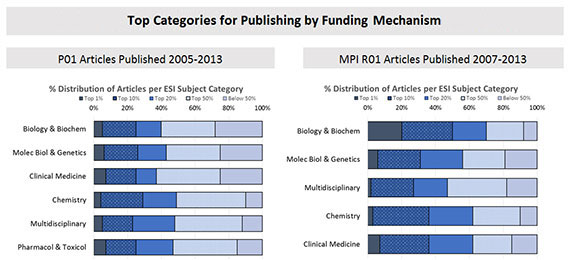
Figure 5. Top Science Field Categories for Publishing by Funding Mechanism. The dark to light bands from left to right represent the distribution of publications by subject category and by funding mechanisms.
Note
RPG funds include the following grant mechanisms: DP1, DP2, R01, R03, R15, R00, R21, R29, R33, R34, R37, P01, U01 and U19.
About the Author