
This page is historical material reflecting the Feedback Loop Blog as it existed on
June 10, 2011. This page is no longer updated and links to external websites
and some internal pages may not work.
June 10, 2011
Archived: Productivity Metrics and Peer Review Scores, Continued
In a previous post, I described some initial results from an analysis of the relationships between a range of productivity metrics and peer review scores. The analysis revealed that these productivity metrics do correlate to some extent with peer review scores but that substantial variation occurs across the population of grants.
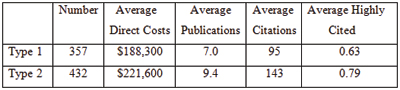
Here, I explore these relationships in more detail. To facilitate this analysis, I separated the awards into new (Type 1) and competing renewal (Type 2) grants. Some parameters for these two classes are shown in Table 1.
 For context, the Fiscal Year 2006 success rate was 26%, and the midpoint on the funding curve was near the 20th percentile.
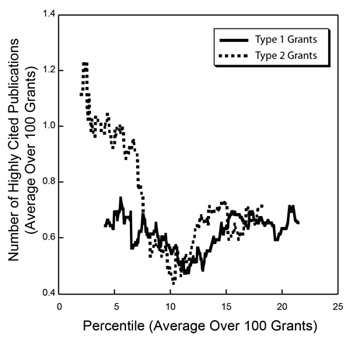
To better visualize trends in the productivity metrics data in light of the large amounts of variability, I calculated running averages over sets of 100 grants separately for the Type 1 and Type 2 groups of grants, shown in Figures 1-3 below.
For context, the Fiscal Year 2006 success rate was 26%, and the midpoint on the funding curve was near the 20th percentile.
To better visualize trends in the productivity metrics data in light of the large amounts of variability, I calculated running averages over sets of 100 grants separately for the Type 1 and Type 2 groups of grants, shown in Figures 1-3 below.
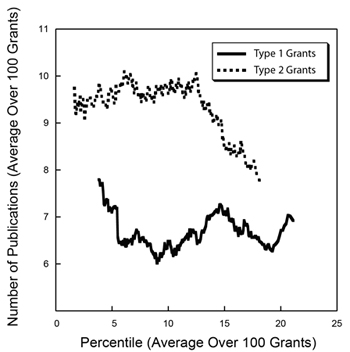
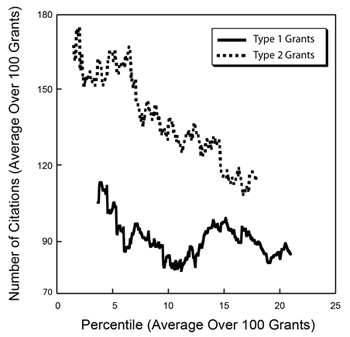
 These graphs show somewhat different behavior for Type 1 and Type 2 grants. For Type 1 grants, the curves are relatively flat, with a small decrease in each metric from the lowest (best) percentile scores that reaches a minimum near the 12th percentile and then increases somewhat. For Type 2 grants, the curves are steeper and somewhat more monotonic.
Note that the curves for the number of highly cited publications for Type 1 and Type 2 grants are nearly superimposable above the 7th percentile. If this metric truly reflects high scientific impact, then the observations that new grants are comparable to competing renewals and that the level of highly cited publications extends through the full range of percentile scores reinforce the need to continue to support new ideas and new investigators.
While these graphs shed light on some of the underlying trends in the productivity metrics and the large amount of variability that is observed, one should be appropriately cautious in interpreting these data given the imperfections in the metrics; the fact that the data reflect only a single year; and the many legitimate sources of variability, such as differences between fields and publishing styles.
These graphs show somewhat different behavior for Type 1 and Type 2 grants. For Type 1 grants, the curves are relatively flat, with a small decrease in each metric from the lowest (best) percentile scores that reaches a minimum near the 12th percentile and then increases somewhat. For Type 2 grants, the curves are steeper and somewhat more monotonic.
Note that the curves for the number of highly cited publications for Type 1 and Type 2 grants are nearly superimposable above the 7th percentile. If this metric truly reflects high scientific impact, then the observations that new grants are comparable to competing renewals and that the level of highly cited publications extends through the full range of percentile scores reinforce the need to continue to support new ideas and new investigators.
While these graphs shed light on some of the underlying trends in the productivity metrics and the large amount of variability that is observed, one should be appropriately cautious in interpreting these data given the imperfections in the metrics; the fact that the data reflect only a single year; and the many legitimate sources of variability, such as differences between fields and publishing styles.
Table 1. Selected parameters for the population of Type 1 (new) and Type 2 (competing renewal) grants funded in Fiscal Year 2006: average numbers of publications, citations and highly cited citations (defined as those being in the top 10% of time-corrected citations for all research publications).
Figure 1. Running averages for the number of publications over sets of 100 grants funded in Fiscal Year 2006 for Type 1 (new, solid line) and Type 2 (competing renewal, dotted line) grants as a function of the average percentile for that set of 100 grants.
Figure 2. Running averages for the number of citations over sets of 100 grants funded in Fiscal Year 2006 for Type 1 (new, solid line) and Type 2 (competing renewal, dotted line) grants as a function of the average percentile for that set of 100 grants.
Figure 3. Running averages for the number of highly cited publications over sets of 100 grants funded in Fiscal Year 2006 for Type 1 (new, solid line) and Type 2 (competing renewal, dotted line) grants as a function of the average percentile for that set of 100 grants.