
This page is historical material reflecting the Feedback Loop Blog as it existed on
September 1, 2010. This page is no longer updated and links to external websites
and some internal pages may not work.
September 1, 2010
Archived: Scoring Analysis with Funding Status
In response to a previous post, a reader requested a plot showing impact score versus percentile for applications for which funding decisions have been made. Below is a plot for 655 NIGMS R01 applications reviewed during the January 2010 Council round.
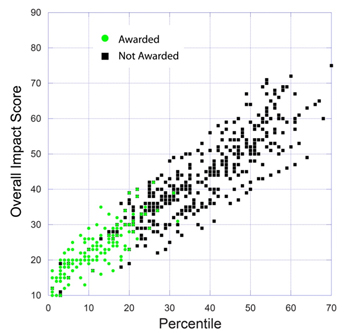 This plot confirms that the percentile representing the halfway point of the funding curve is slightly above the 20th percentile, as expected from previously posted data.
Notice that there is a small number of applications with percentile scores better than the 20th percentile for which awards have not been made. Most of these correspond to new (Type 1, not competing renewal) applications that are subject to the NIGMS Council’s funding decision guidelines for well-funded laboratories.
This plot confirms that the percentile representing the halfway point of the funding curve is slightly above the 20th percentile, as expected from previously posted data.
Notice that there is a small number of applications with percentile scores better than the 20th percentile for which awards have not been made. Most of these correspond to new (Type 1, not competing renewal) applications that are subject to the NIGMS Council’s funding decision guidelines for well-funded laboratories.
A plot of the overall impact score versus the percentile for 655 NIGMS R01 applications reviewed during the January 2010 Council round. Green circles show applications for which awards have been made. Black squares show applications for which awards have not been made.