
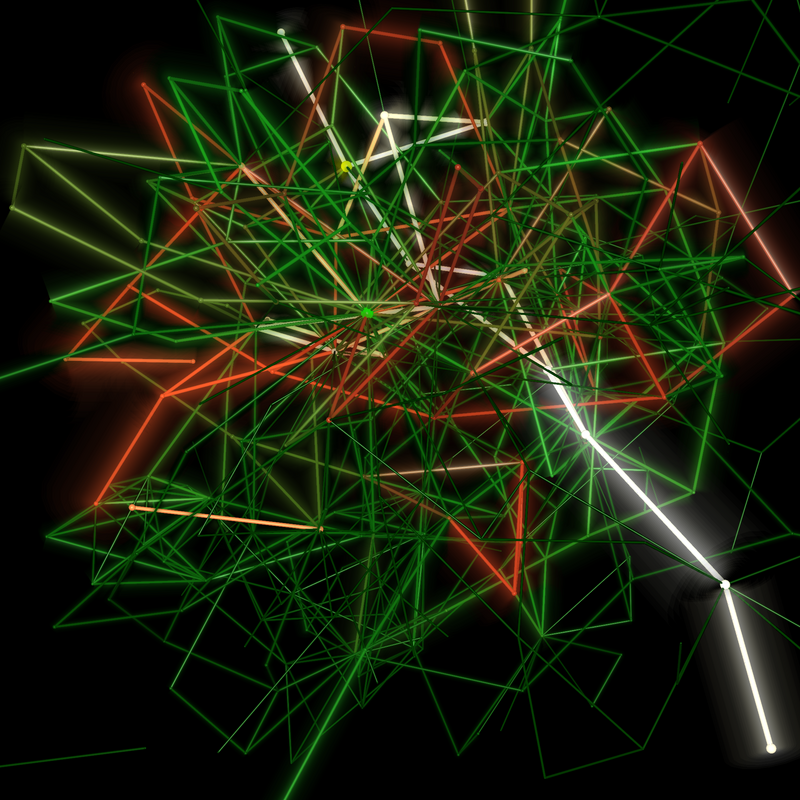
Image Gallery: Mapping metabolic activity
ID
2319
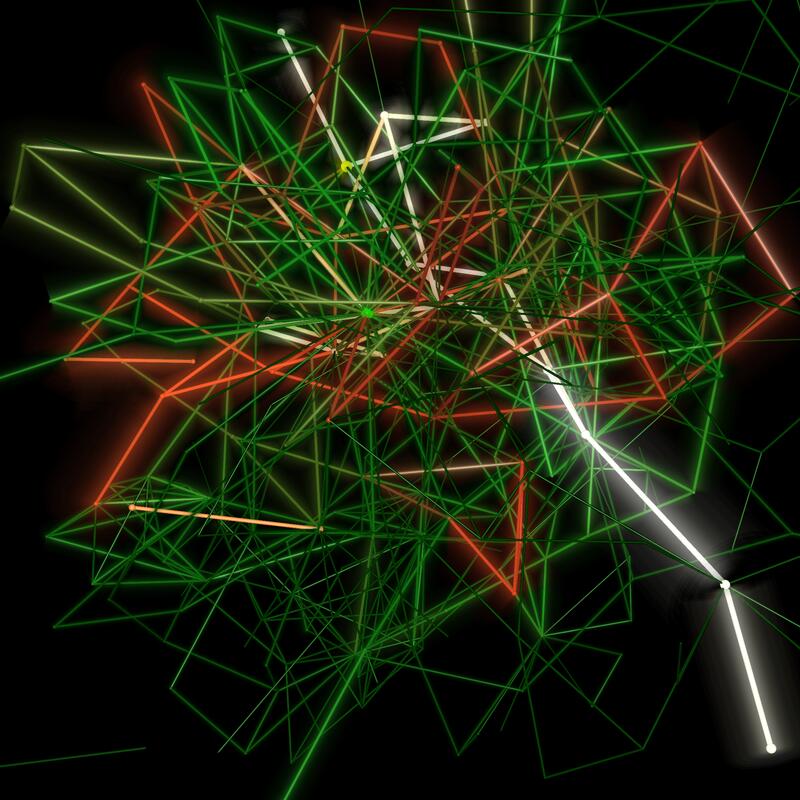
Like a map showing heavily traveled roads, this mathematical model of metabolic activity inside an E. coli cell shows the busiest pathway in white. Reaction pathways used less frequently by the cell are marked in red (moderate activity) and green (even less activity). Visualizations like this one may help scientists identify drug targets that block key metabolic pathways in bacteria.
Source
Albert-László Barabási, University of Notre Dame
Topics
